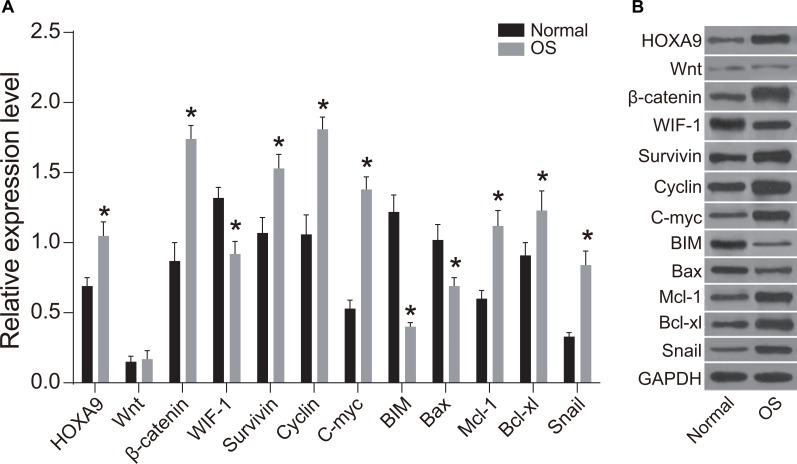
Figure 3. Western blot analysis of WIF-1, BIM, Bax, HOXA9, Wnt, β-catenin, Survivin, Cyclin D1, c-Myc, Mcl-1, Bcl-xL, and Snail expression in OS compared to normal tissue.
(A) Histogram showing the relative expression of WIF-1, BIM, Bax, HOXA9, Wnt, β-catenin, Survivin, Cyclin D1, c-Myc, Mcl-1, Bcl-xL, and Snail in OS compared to normal tissue; (B) Western blot images of protein expression in OS compared to normal tissue; *P < 0.05.

