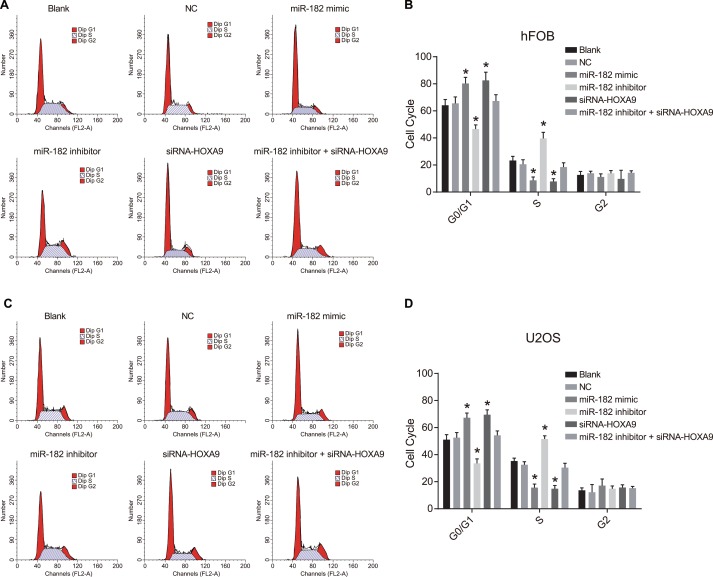
Figure 9. PI staining to analyze differences in cell cycle progression between the six groups.
(A) Images showing differences in cell cycle phase in hFOB cells between the six groups; (B) Percentage of hFOB cells in the indicated cell cycle phases among the six groups; (C) Images showing differences in cell cycle phase in U-2OS cells between the six groups; (D) Percentage of U-2OS cells in the indicated cell cycle phases among the six groups; *P < 0.05, compared to the blank and NC groups.

