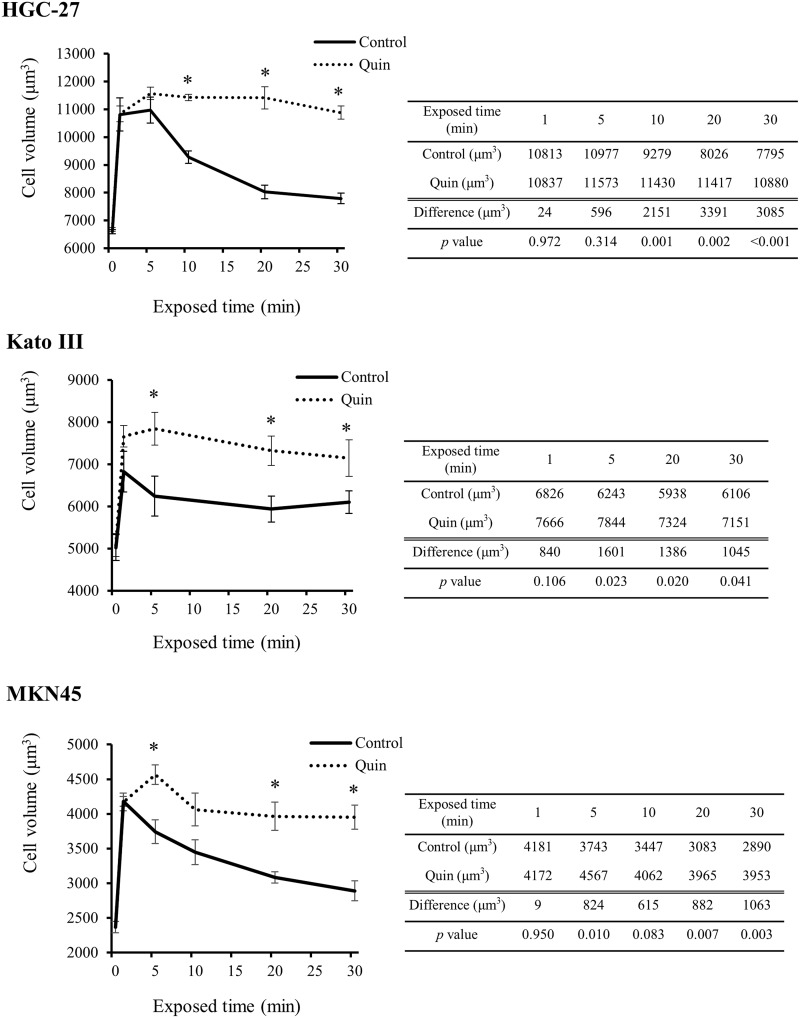
Figure 3. Effects of blockade of potassium ion transports on hypotonicity-induced cell volume changes in GC cells.
Serial changes in mean cell volume (MCV) of HGC-27, Kato III, and MKN45 cells after 1, 5, 10, 20, and 30 min exposure to the 1/2 NaCl solution with 1 mM quinine hydrochloride (Quin) or 1/2 NaCl solution alone (control) were shown. Data were represented as mean ± SEM (n=3). The cell volume in the isotonic NaCl solution with or without Quin was used as a sample without hypotonic stimulation (0 min). *P < 0.05.

