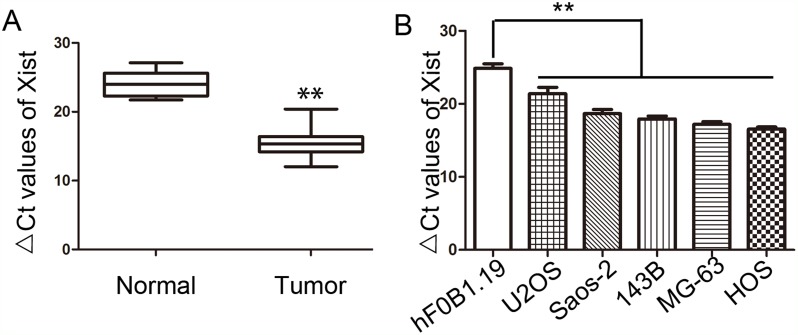
Figure 1. Expression of Xist in OS tissues and OS cell lines.
(A) Relative expression of Xist in OS tissues and the corresponding non-tumor tissues were detected by qRT-PCR. (B) Relative expression of Xist in five OS cell lines and osteoblastic cell line hFOB1.19 were detected by qRT-PCR. Data were shown using 2-ΔCT values. GAPDH was used for normalization. **P<0.01.

