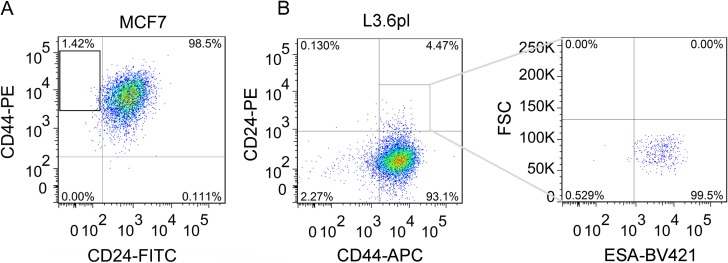
Figure 1. Isolation of breast CD44+CD24- CSCs and pancreatic CD44+CD24+ESA+ CSCs from MCF7 and L3.6pl cells by flow cytometry.
(A) Typical proportion of CD44+CD24– cells in MCF7 cells. The isolated CD44+CD24– CSCs were obtained as shown in the frame of A and cultured 1d for re-analysis by flow cytometry (Supplementary Figure 1A). (B) Fluorescence activated cell-sorting (FACS) analysis to measure CD44 and CD24 expression of L3.6pl cells (Left) and the patterns of ESA staining of CD24+CD44+ cells as shown in the frame of panel B Left (Right).

