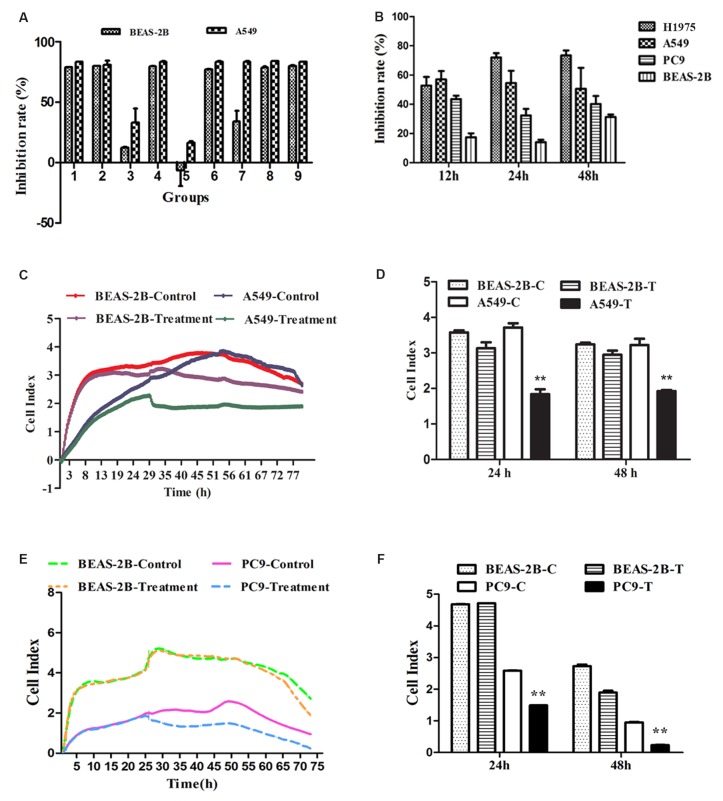
Figure 1. The effects of FMG on lung cancer cell proliferation and viability.
(A) The orthogonal design of L9 (3)4 provided 9 groups of different dose combinations. The inhibition ratio of BEAS-2B and A549 cells showed that the optimal combination was Group 5(A2B2D1, FMG). (B) Selective inhibitory effects of FMG on lung cancer cells. Cells were treated with FMG for 12 h, 24 h, 48 h, and processed of MTT assay. (C) BEAS-2B and A549 cells were seeded in E-plates at density of 1×10⁵ cells/well, cultured for 24 h, and treated with FMG for automated real-time monitoring 48 h in the RTCA-DP instrument. (D) The impedance is displayed as a dimensionless parameter termed the “cell index”, which is directly proportional to the total area of tissue culture well that is covered by the cells. Quantification of cell viability on BEAS-2B and A549 cells. Values expressed as mean ± SD from three independent experiments, *P < 0.05, **P < 0.01 vs. control group. (E) BEAS-2B and PC9 cells were seeded in E-plates at density of 1×10⁵ cells/well, cultured for 24 h, and treated with FMG for automated real-time monitoring 48 h in the RTCA-DP instrument. (F) Quantification of cell viability on BEAS-2B and PC9 cells. Values expressed as mean ± SD from three independent experiments, *P < 0.05, **P < 0.01 vs. control group.

