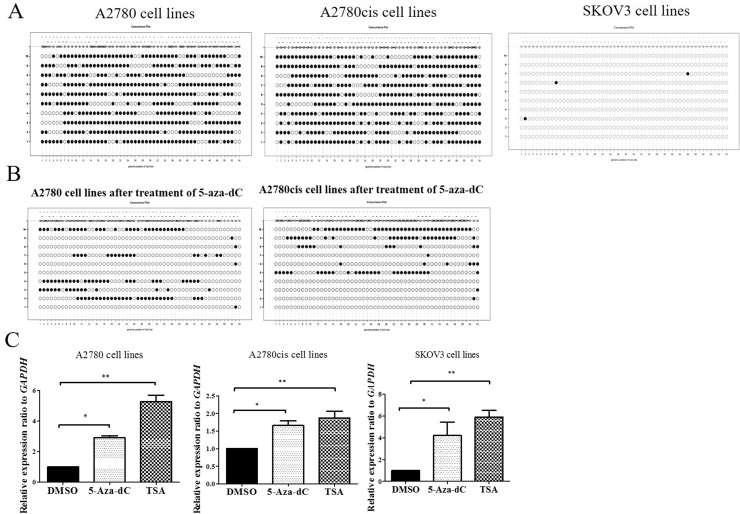
Figure 6. DNA methylation analysis of promoter regions of CCDC69 in ovarian cancer cell lines.
(A) Representative methylation patterns in promoter regions of CCDC69 in A2780, A2780cis and SKOV3 ovarian cancer cell lines before treatment with 5-aza-dC. (B) Representative methylation patterns in CCDC69 CpG islands observed in A2780 and A2780cis after treatment with 5-aza-dC. (C) Effect of 5-aza-dC and TSA on CCDC69 expression in A2780, A2780cis and SKOV3 ovarian cancer cell lines. Bisulfite sequencing was performed and the results were visualized by MethVisual [28]. Lollipop displays for each 10 cloning methylation profiles in the genomic context are shown. Filled dots refer to methylated sites, empty dots to non-methylated sites. Each clone of the experiment is displayed separately according to its methylation status. Lengths of the connecting lines correspond to relative genomic distance between CpG sites. Mann–Whitney U-test, (*) P < 0.05; (**) P < 0.01.

