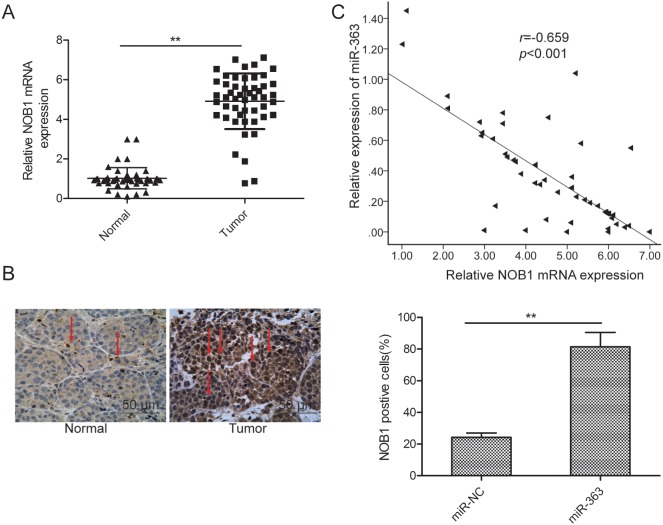
Figure 6. NOB1 expression inversely correlates with miR-363 levels in patient OC tissues.
(A) qRT-PCR analysis of NOB1 mRNA expression in 50 paired OC and adjacent normal tissues. GAPDH was used as an internal control. (B) Immunohistochemical analysis of NOB1 protein expression in OC tissue samples. (C) Spearman's correlation analysis of the association between the NOB1 and miR-363 expression in human ovarian cancer (n=50). Note: * denotes p<0.05;** denotes p<0.01.

