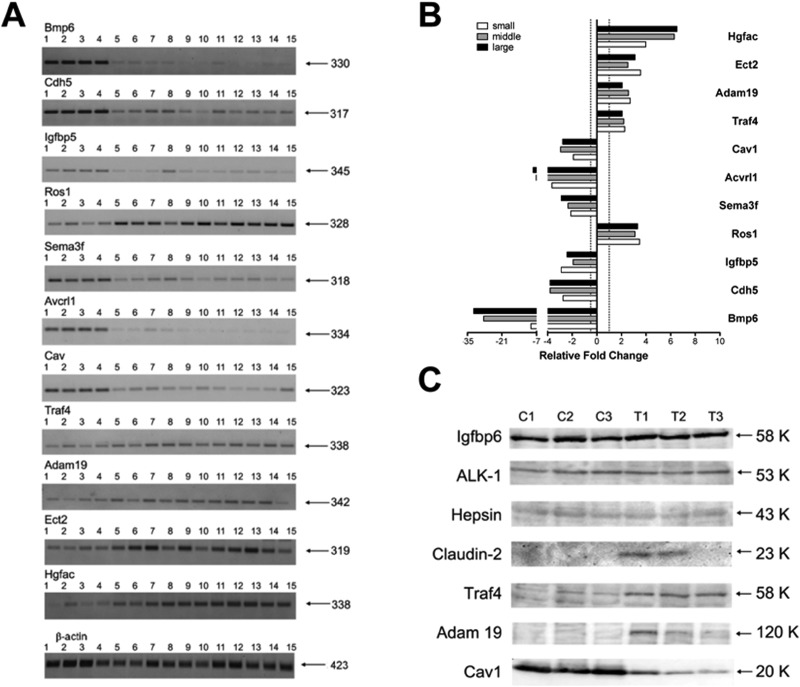
Figure 1. RT-PCR and Western blotting of novel c-Myc candidate genes in papillary lung adenocarcinomas.
(A) Semi-quantitative RT-PCRs for selected genes. Lanes 1–4: control lung tissues; lanes 5–8: pools of small-size tumors; lanes 9–11: middle-size tumors; lanes 12–15: large-size tumors. Indicated on the right is the size in base pairs of the PCR amplicons. (B) Bars represent the averages and standard deviations of band intensities from panel A for the three groups of samples (small, middle and large tumors) normalized on the β-actin reference gene. The area from each band was calculated with Image J software and used for generating averages. (C) Western blot analysis of selected genes. C1–C3: control non-transgenic lung; T1–T3: lung adenocarcinomas of SPC/c-Myc-transgenic mice. Indicated on the right is the size in kDa of immunoreactive bands.

