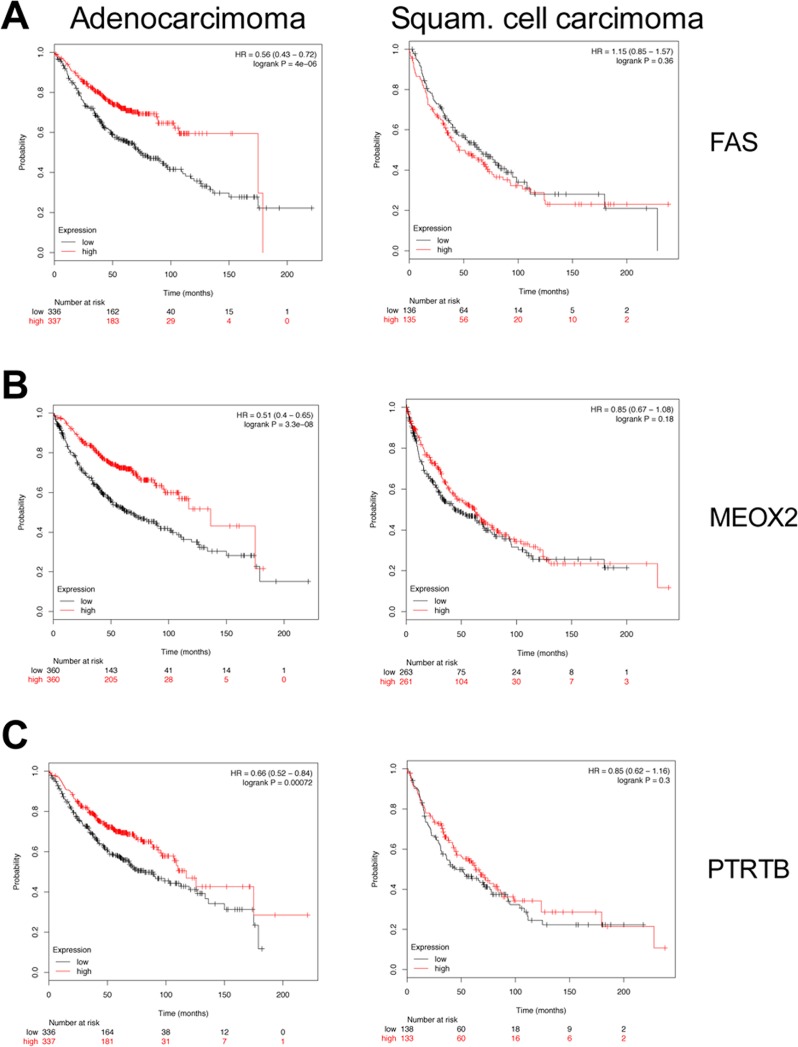
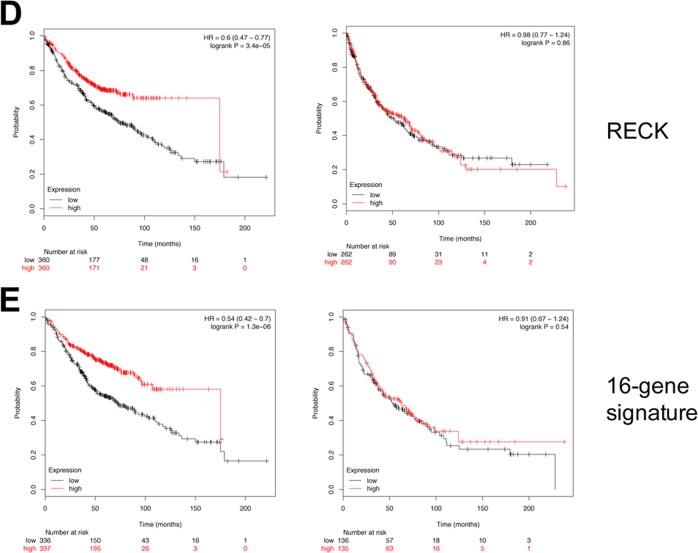
Figure 4. Kaplan–Meier survival statistics of c-Myc repressed target genes.
(A–E) Kaplan–Meier curves of lung adenocarcinoma (left panels) and lung squamous cell carcinoma (right panels) were generated using KM-plotter tool by considering the expression of down-regulated genes in c-Myc transgenic lung tumors. Red and black curves always represent patients with high and low expression levels, respectively, of the selected gene. Given underneath each curve is the number of patients. Additionally, the Hazard Ratios and the p-values are shown in the plot. (E) A “13-gene signature” of strongly down-regulated genes (FC < –10 as average of the c-Myc transgenic PLAC tumors) was evaluated for clinical relevance in human lung cancers (see Supplementary Table 3).


