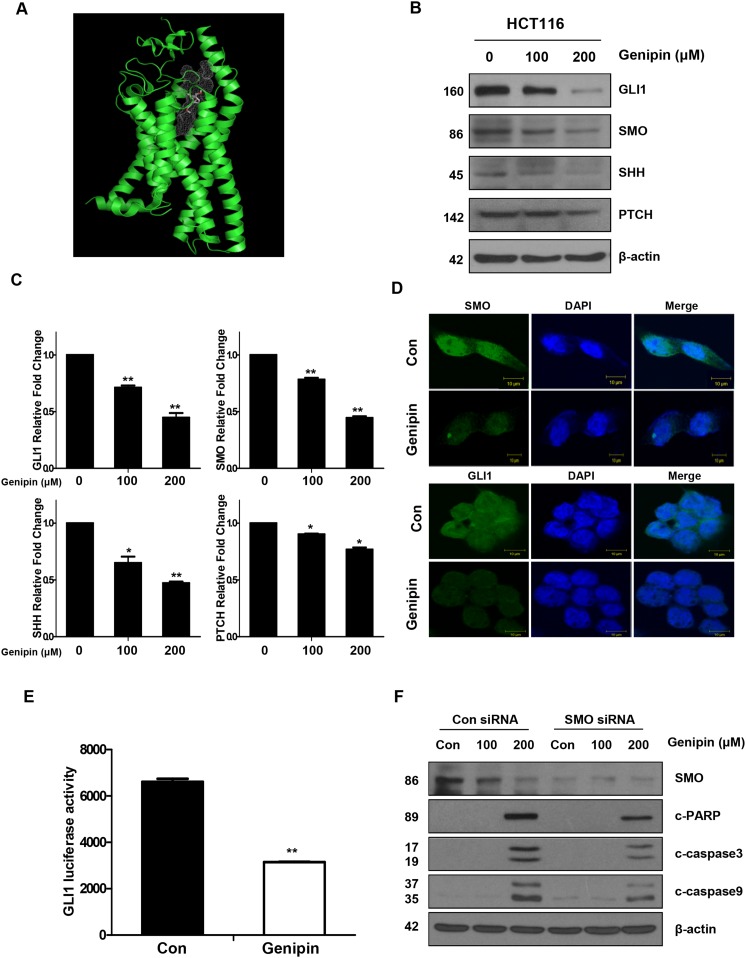
Figure 2.
(A) SMO domain (green). (B) The protein expression levels of GLI1, SMO, SHH, and PTCH were measured by western blotting. β-Actin was used as a loading control. (C) The mRNA levels of GLI1, SMO, SHH, and PTCH were measured by real time PCR. Expression was normalized to that of GAPDH. (D) The immunofluorescence of SMO and GLI1 was detected by confocal laser-scanning microscopy (original magnification: 40×). Bar, 10 μm. (E) GLI1-luciferase activity induced by genipin. Cells were transfected with a GLI-dependent luciferase reporter construct, and then luciferase activity was normalized to that of the pRL-TK vector. (F) SMO was silenced in HCT116 cells with an SMO siRNA. The levels of cleaved PARP, CASP3, and CASP9 were detected by western blotting. β-Actin was used as a loading control. Data are expressed as the means of three independent experiments. **P < 0.01, *P < 0.05.

