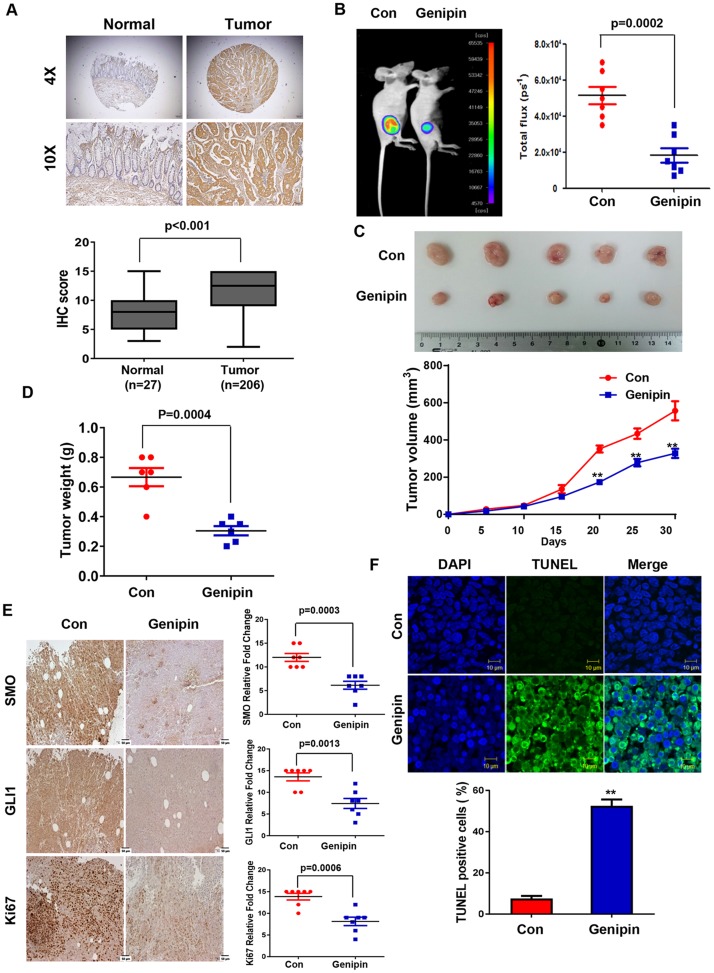
Figure 5.
(A) Representative immunofluorescence image of human colon cancer specimens stained for SMO at magnifications of 4× and 10× (upper). Box plots indicate the percentage area of SMO-positive tissue in normal (n = 27) and tumor (n = 206) samples. (B) HCT116-luc cells were implanted subcutaneously in nude mice, and then tumor growth was evaluated by measuring fluorescent intensity after 3 weeks of treatment with genipin (20 mg/kg every 2 days; n = 8). (C) Representative tumor volume in xenograft nude mice. Tumor dimensions were measured every two days. (D) Tumor weight was measured at termination of the experiment. (E) Immunohistochemical (IHC) staining showing SMO, GLI1, and KI67 in tumors from xenograft mice at 20× magnification. Scale bar, 50 μm. Graphs showing IHC staining of SMO, GLI1, and KI67 (right). (F) Tumors were evaluated by TUNEL assay, and DAPI was used to visualize the nucleus (upper). The percentage of TUNEL-positive cells was determined and plotted as a histogram (lower).

