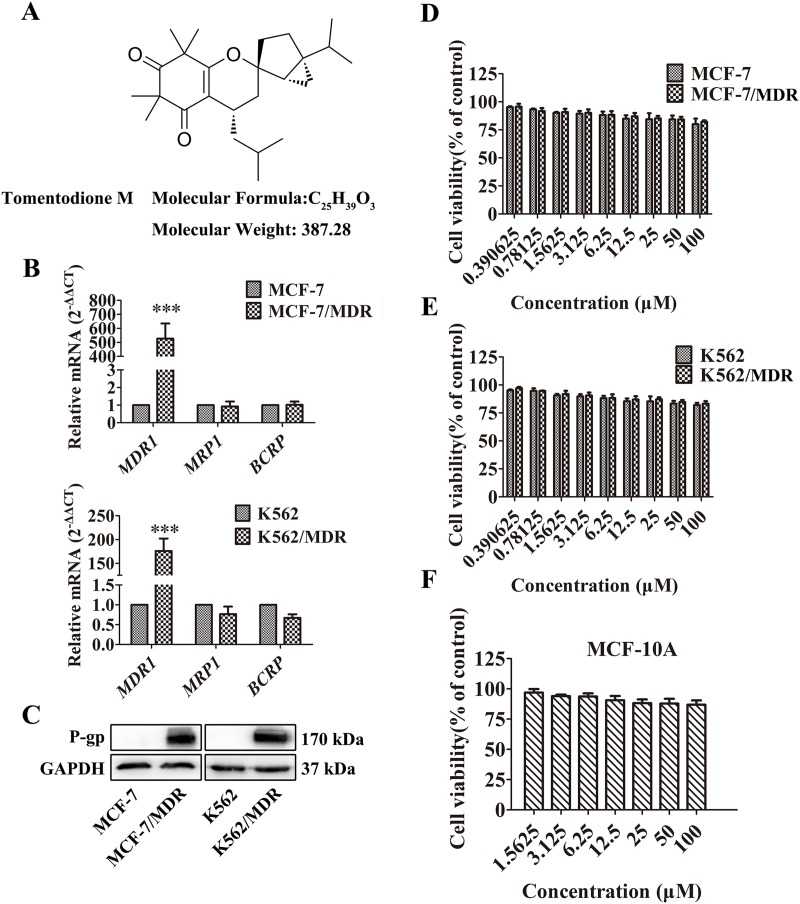
Figure 1. Effect of TTM on cancer cell toxicity and expression of ABC transporters.
(A) Chemical structure and molecular weight of Tomentodione M (TTM). (B) QRT-PCR analysis of MDR1, MRP1 and BCRP mRNA levels relative to GAPDH in parental and multi-drug resistant (MDR) MCF-7 and K562 cancer cells. Note: The relative mRNA levels are expressed as fold-changes relative to control group, which is arbitrarily represented as 1. The data are representative of at least 6 replicates. (C) Representative western blot showing P-gp protein levels in MCF-7/MDR and K562/MDR cells relative to their corresponding parental cells. GAPDH was used as loading control. (D-F) MTT and CCK-8 assays showing cell viability of multidrug resistant cell lines (MCF-7/MDR and K562/MDR) and their corresponding parental cell lines (MCF-7 and K562), as well as non-tumor cell line (MCF-10A) treated with 0-100 μM TTM for 48 hr. Inhibition of cell proliferation by different concentrations of TTM were calculated based on the ratio of absorbance in treatment and control samples. The absorbance was evaluated at a test wavelength of 570 nm, and a reference wavelength of 630 nm in MTT assays. The absorbance at 450 nm was used in CCK-8 assays. Note: Values represent mean ± SEM from three independent experiments. *** denotes P < 0.001 compared to control.

