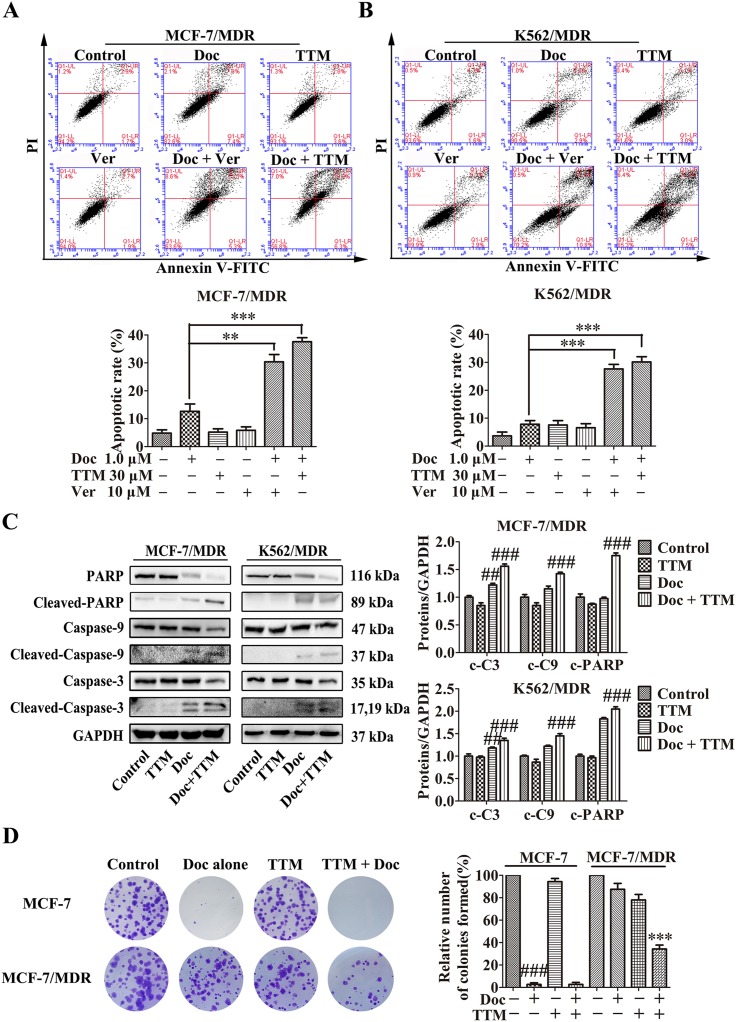
Figure 2. Effect of TTM on apoptosis and clonogenicity of Doc-treated MDR cancer cells.
(A-B) Flow cytometry analysis of cellular apoptosis in (A) MCF-7/MDR and (B) K562/MDR cells treated with 1 μM Doc, 30 μM TTM, 10 μM Ver, or combination of 1 μM Doc plus 10 μM Ver plus 30 μM TTM for 48 hr as determined by AnnexinV-FITC/PI staining. Note: Data represent three independent experiments. As shown, MDR cells were resistant to Doc, and both TTM and Ver enhanced Doc-induced apoptosis. ** denotes P < 0.01 and *** denotes P < 0.001 compared to Doc alone treatment. (C) Quantitative western blot analysis of procaspase-9, cleaved caspase-9, procaspase-3, cleaved caspase-3, PARP and cleaved PARP in MCF-7/MDR and K562/MDR cells incubated with 1 μM Doc with or without 30 μM TTM for 48 hr. Note: GAPDH was used as internal control. ## denotes P < 0.01 and ### denotes P < 0.001 compared to control. (D) Histogram plots showing total number of colonies in MCF-7 and MCF-7/MDR cells treated with 1 μM Doc with or without 30 μM TTM for 48 hr. Note: Cells were plated in 6-well plates containing RPMI 1640 plus 10% FBS at a density of 1000 cells per well. Colonies were counted after 15 days. The data are presented as the mean ± SEM from three independent experiments. ### denotes P < 0.001 compared to control. *** denotes P < 0.001 compared to Doc alone treatment.

