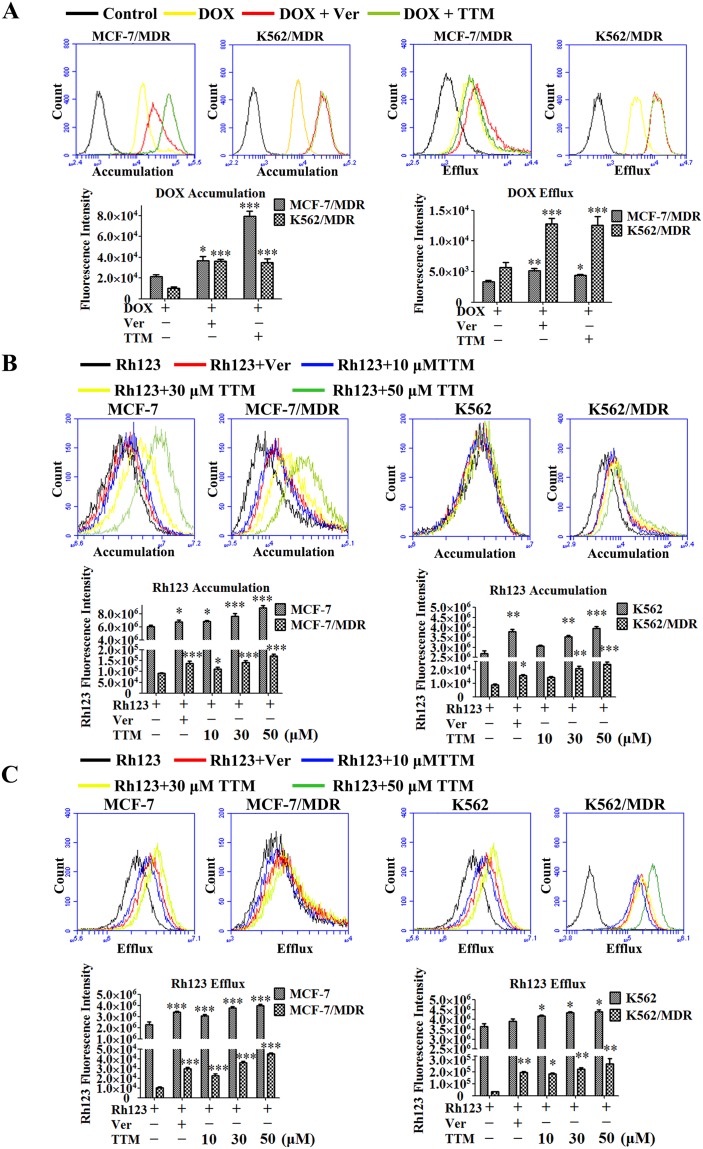
Figure 3. Effect of TTM on the accumulation and efflux of DOX and Rh123 in MDR cancer cells.
(A) Histogram plots showing flow cytometry analysis of intracellular DOX accumulation in MCF-7/MDR and K562/MDR cells pre-incubated for 4 hr with or without 10 μM TTM or 10 μM Ver (positive control) followed by incubation with 10 μM DOX as determined by flow cytometry. Also shown are histogram plots for DOX retention assay, wherein MDR cells were pre-incubated for 3 hr with 10 μM DOX followed by incubation for 4 hr in medium with or without 10 μM TTM or 10 μM Ver. Subsequently, intracellular DOX levels were determined by flow cytometry. (B) Histogram plots showing flow cytometry analysis of Rh123 dye accumulation in MDR and parental MCF-7 and K562 cells pretreated with or without 10, 30, 50 μM TTM or 10 μM Ver for 1.5 hr followed by incubation with 5 μM Rh123 in the dark for 1.5 hr. (C) Histogram plots showing flow cytometry analysis of Rh123 efflux in MDR and parental MCF-7 and K562 cells that were first incubated with 5 μM Rh123 in the dark for 1.5 hr followed by incubation with or without 10, 30, 50 μM TTM or 10 μM Ver for 1.5 hr. Intracellular fluorescence of Rh123 was detected by flow cytometry. Note: The data are represented as the mean ± SEM from three independent experiments. * denotes P < 0.05, ** denotes P < 0.01 and *** denotes P < 0.001 compared to DOX or Rh123 alone treatments.

