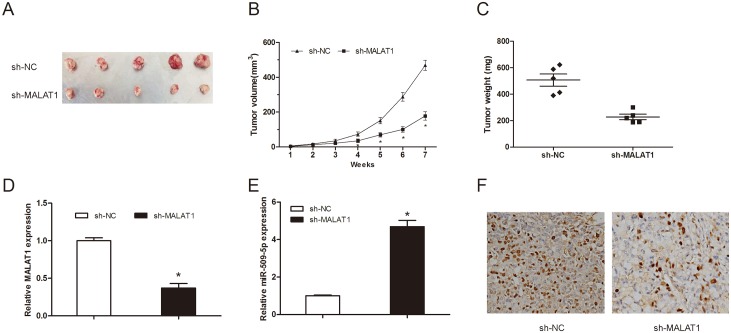
Figure 3. MALAT1 knockdown inhibited tumor growth in vivo.
(A) The subcutaneous tumors were taken photos in sh-MALAT1 or sh-NC groups. (B) Tumor volume was measured every 1 week. (C) The subcutaneous tumors were weighted in sh-MALAT1 or sh-NC groups. (D) MALAT1 expression in tumor tissues was detected by qRT-PCR. (E) MiR-509-5p expression in tumor tissues was detected by qRT-PCR. (F) The expression of Ki-67 in xenograft samples was assessed by IHC staining. ** P<0.01; * P < 0.05.

