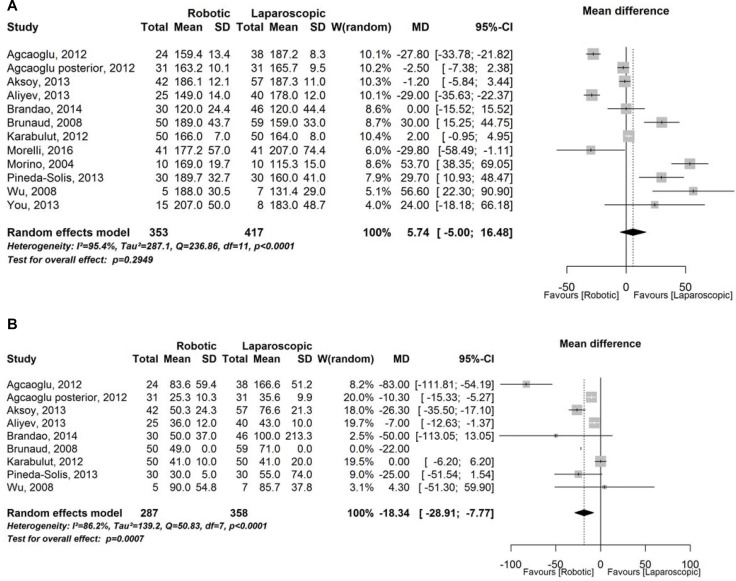
Figure 3. Operative variable.
(A) Forest plot representing analysis of operative time. CI = confidence interval; MD = mean difference; SD = standard deviation; W = Weight; (B) Forest plot representing analysis of estimated blood loss. CI = confidence interval; MD = mean difference; SD = standard deviation; W = Weight.

