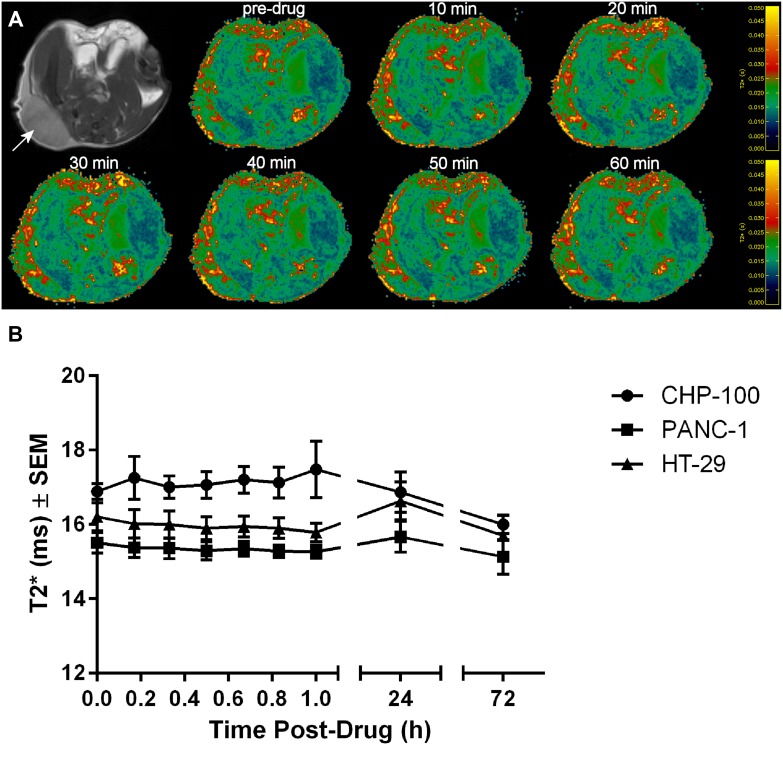
Figure 4. BOLD MRI of 3 tumor models.
(A) Anatomic reference images and example T2* maps acquired in a mouse bearing a CHP-100 tumor (arrow); the color scale runs from 0 ms (dark blue) through 50 ms (yellow). (B) T2* maps were acquired before and through 60 min after RRx-001 treatment, and again at 24 h and 72 h post-drug. The variation of tumor T2* (mean ± S.E.M., n = 4) before vs. after treatment with RRx-001 (10 mg/kg, i.v.).

