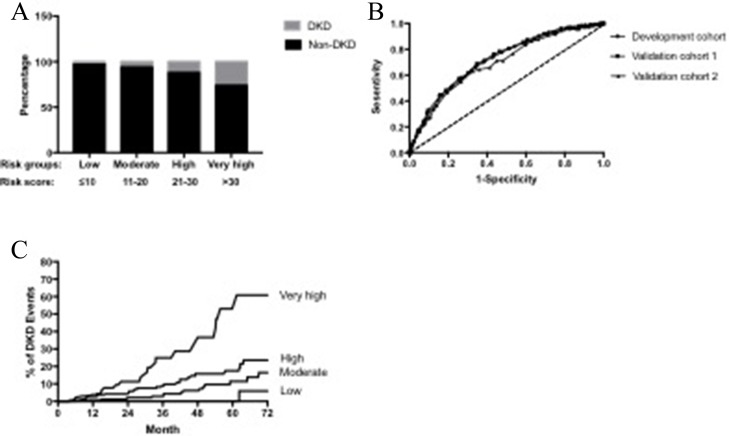
Figure 2.
(A) Prevalence of DKD in four risk groups stratified by risk score in the development population. (B) Receiver operating curve (ROC) for the development, validation 1 and validation 2 cohorts. The AUC of development, validation1 and validation 2 were 0.713(0.692–0.734), 0.720 (0.696–0.744) and 0.696(0.632–0.760), respectively. Difference between the curves for DKD was not significant (U = 0.43, P = 0.667). (C) Kaplan-Meier curve of DKD end point for each risk group. Moderate group: HR 2.04 (95% confidence interval [CI] 0.76 to 5.46), P = 0.23. High group: HR 3.97 (95% CI 1.90 to 8.33), P = 0.01. Very high group: Hazard ratio (HR) 11.37 (95% CI 4.76 to 27.19), P < 0.0001. Low risk group: Reference.

