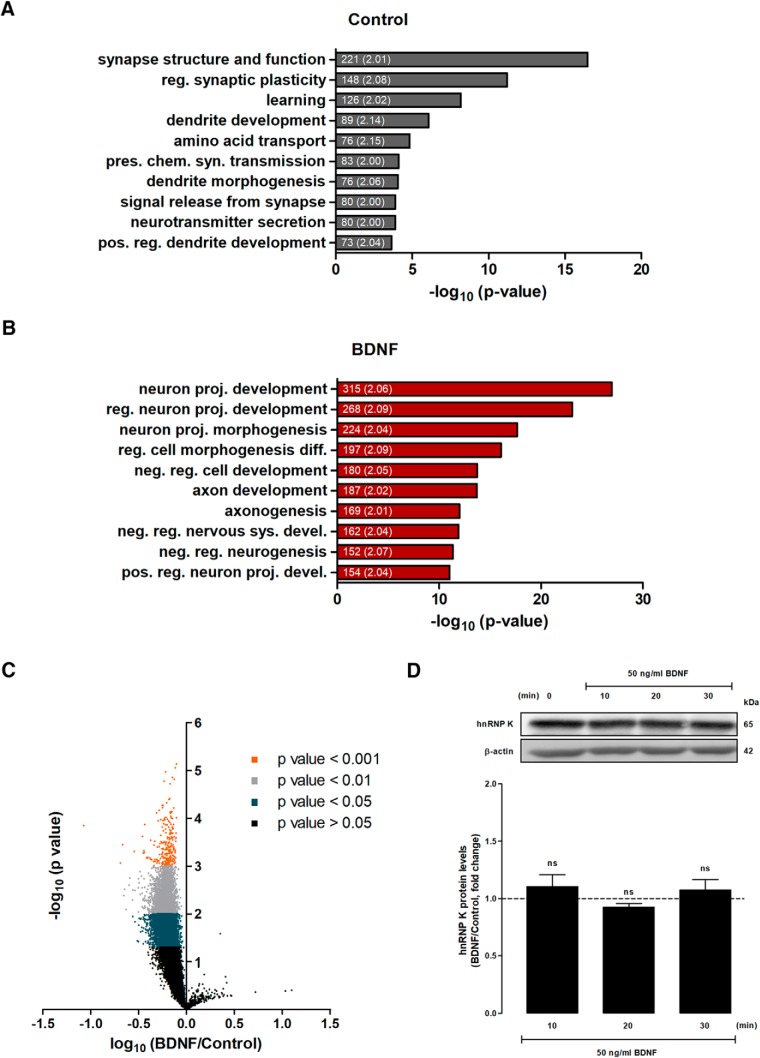
Figure 2.
Stimulation of hippocampal neurons with BDNF decreases the interaction of hnRNP K with a large number of transcripts. A, B, List of the 10 most significantly enriched biological processes associated with mRNAs bound to hnRNP K (A) and those that were regulated by BDNF (50 ng/ml for 10 min) (B), identified with the PANTHER classification system. Only categories showing at least a 2-fold enrichment (considering the size of our lists) were analyzed and the 10 categories displaying the highest –log10 (p value) are shown. The number of transcripts belonging to each category and the fold change (designated in parenthesis) are indicated within graph bars. reg., regulation; pres., presynaptic; chem, chemical; syn., synaptic; pos., positive; proj., projection; diff., differentiation; neg., negative; sys., system; devel., development. C, Cultured hippocampal neurons were stimulated or not with BDNF (50 ng/ml) for 10 min before preparation of cellular extracts. hnRNP K was immunoprecipitated from control and BDNF-treated hippocampal neuron homogenates, and the associated transcripts were identified by microarray analysis. The specificity of transcripts associated with hnRNP K was assessed by subtracting the levels of correspondent mRNAs pulled down together with mouse IgG antibodies. hnRNP K-associated mRNAs were then compared between control and BDNF treated neurons. The results were obtained from the quantification of four different experiments performed in independent preparations, and are expressed as -log (p value) and log fold change (BDNF vs control). A total of 9509 transcripts showed a decrease in the interaction with hnRNP K in cells stimulated with BDNF; p < 0.05 (gray dots) as determined by the paired Student’s t-test. D, Stimulation of cultured hippocampal neurons with BDNF does not affect total hnRNP K protein levels. Hippocampal neurons were stimulated with BDNF for 10, 20, and 30 min, and the cellular extracts were analyzed by Western blotting. β-Actin was used as loading control. The results represent quantification of three independent experiments, and are expressed as percentage (mean ± SEM) of control. ns, nonsignificant as determined by ANOVA followed by Dunnett's multiple comparison test.

