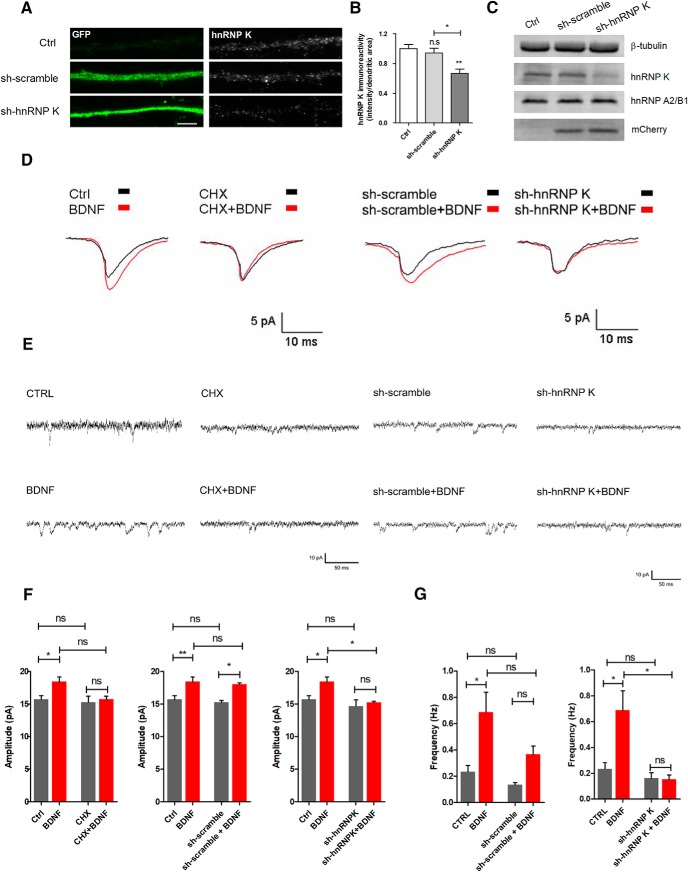
Figure 7.
BDNF upregulates NMDAR-mediated mEPSC by a mechanism dependent on hnRNP K. A, Low-density cultured hippocampal neurons were transduced with shRNA (sh-hnRNP K; sh-scramble, which does not target a specific sequence) constructs at DIV11. The cells were fixed at DIV14 and then immunostained for hnRNP K (gray), GFP (green), and MAP2 (not shown in the figure). The hnRNP K immunoreactivity was measured in dendrites (A, B), using the ImageJ software. Results are normalized to control and are the average of three to four different experiments performed in independent preparations (19–34 cells analyzed in neurons expressing the shRNAs for 3 d). C, Western blot analysis of hnRNP K, hnRNP A2/B1, β-tubulin (loading control), and mCherry (infection control), in cultured hippocampal neurons transduced or not with sh-hnRNP K and sh-scramble constructs. D, E, NMDAR-mediated mEPSC were recorded under control conditions (n = 13) and after 30 min of stimulation with BDNF (50 ng/ml; n = 14). Where indicated, the cells were transfected with sh-scramble (n = 6) or sh-hnRNP K (n = 6), or incubated with cycloheximide (50 µg/ml). The cells were preincubated with the translation inhibitor for 15 min before stimulation with BDNF. Cells transfected with sh-hnRNP K or incubated with cycloheximide showed no significant increase in the amplitude of NMDAR-mediated mEPSC on BDNF treatment, while the scramble shRNA was without effect (F). Analysis of NMDAR-mediated mEPSC frequency in nontransfected cells (n = 12) and cells transfected with sh-sramble (n = 8) or sh-hnRNP K (n = 6), under control conditions and following BDNF stimulation (G). The average mEPSC traces recorded are shown in D and representative traces are shown in E. Results are presented as mean ± SEM for the indicated number of experiments. Statistical analysis was performed by one-way ANOVA, followed by Bonferroni’s multiple comparison test. n.s., not significant; *p < 0.05; **p < 0.01. Scale bar: 5 μm.

