
Figure 11.
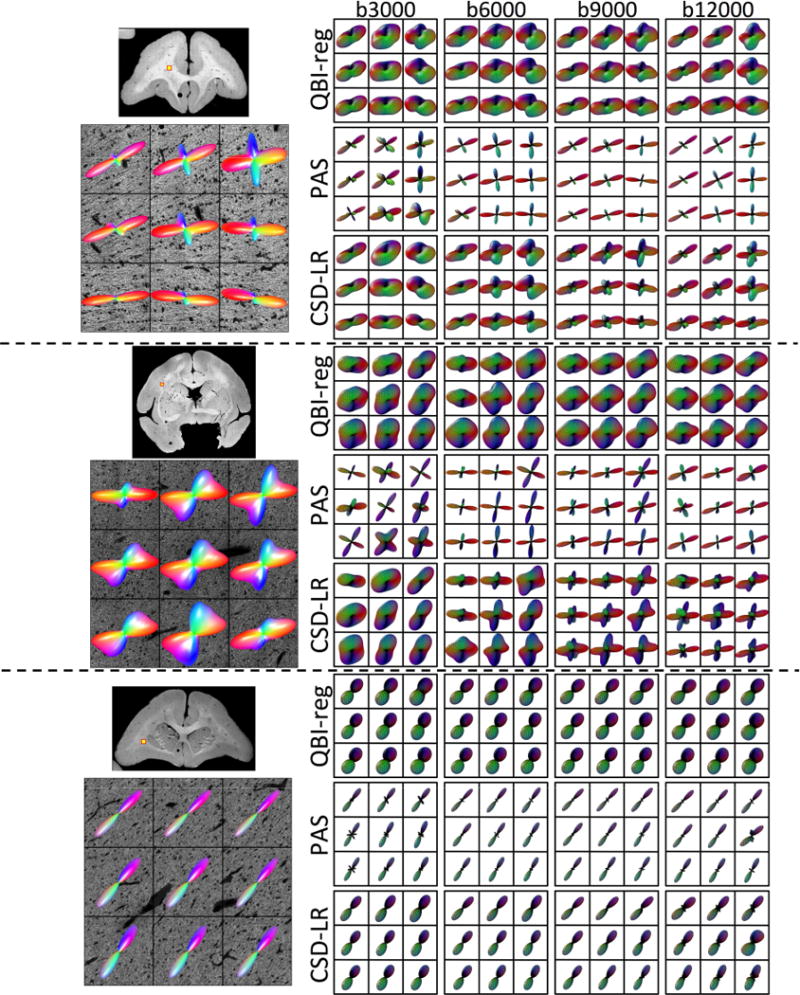
Effects of b-value on reconstruction accuracy - qualitative results. Histological FODs are shown overlaid on confocal images for three z-stacks. The voxels represent fibers crossing at near-orthogonal angles (top), fibers crossing at acute angles (middle), and a typical single fiber region (bottom). MRI-derived glyphs for three selected reconstruction methods are shown for each histological slice.