
Figure 3.
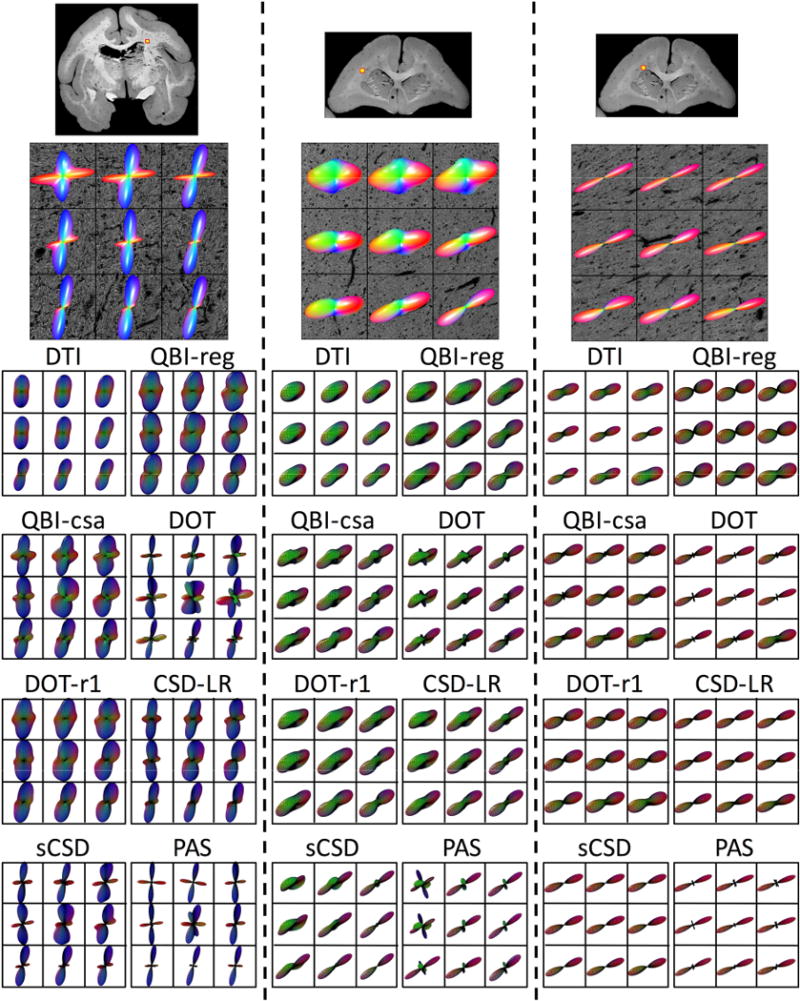
Effects of fiber geometry on reconstruction accuracy - qualitative results. Histological FODs are shown overlaid on confocal images for three z-stacks. Z-stack locations are shown as yellow boxes overlaid on 2D confocal montages (top). The voxels represent typical crossing fibers (left), fibers crossing both in-plane and through-plane (middle), and a typical single fiber regions (right). MRI data was analyzed at corresponding locations, and glyphs for all eight reconstruction methods are shown below each histological slice. Note that DTI results are displayed as the ADC profile.