
Figure 6.
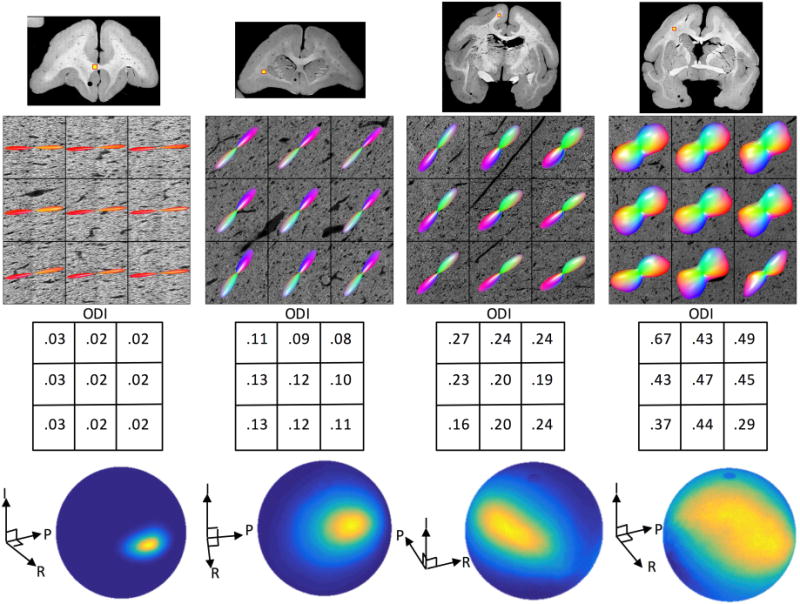
Histological dispersion in the brain WM. A range of fiber orientation dispersion is shown, ranging from low ODI (left) to high ODI (right). Dispersion is visualized with both 3D glyphs as well as orientation distributions on a sphere (for the center voxel of each stack). We note that ODI values between 0.08–0.13 are most typical of WM encountered in this study (in voxels containing single fiber populations).