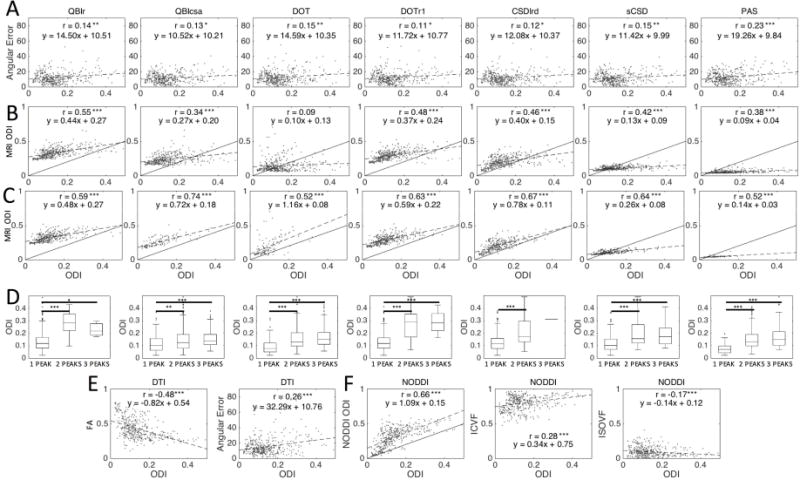
Figure 7.

Effects of histological dispersion on MRI orientation and dispersion measures. MRI angular error (A) and MRI ODI estimates (B) are plotted against histological ODI in single fiber voxels. For all methods, large histological ODI consistently resulted in two or more distinct MRI peaks (D), and when FP voxels are removed, MRI-ODI correlations with histology-ODI are increased (C). DTI measures of FA and angular error (E), and NODDI measures of ODI, ICVF, and ISOVF (F) are plotted against histology-ODI. Significance levels are indicated by asterisks (*p<0.05; **p<0.01; ***p<0.001).
