
Figure 6.
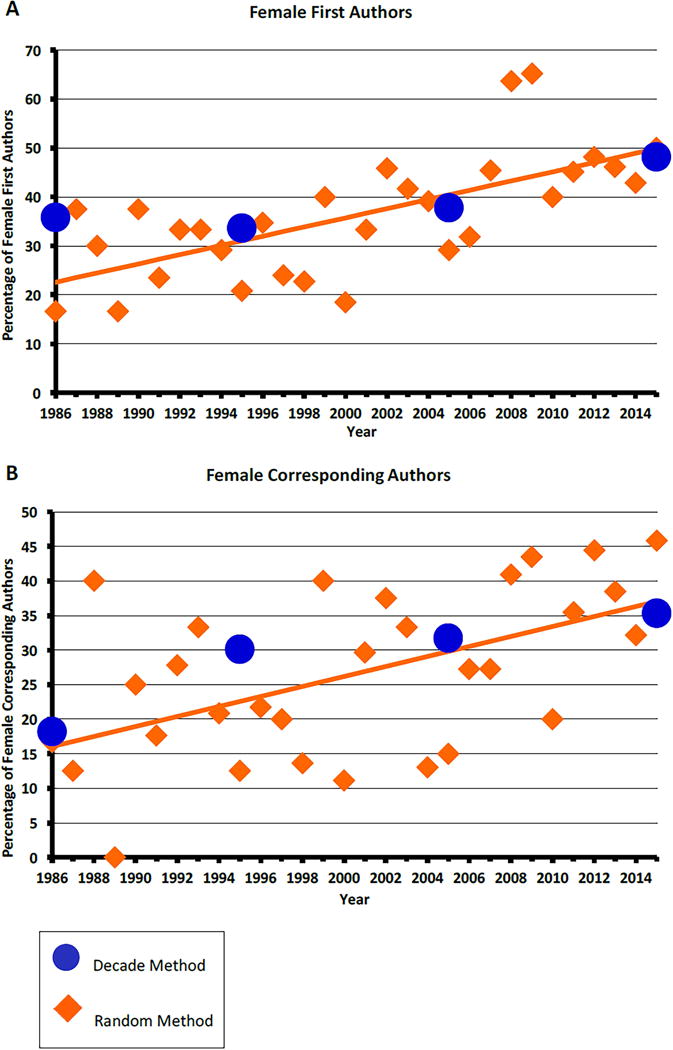
Changes over time in the percentage of female first (A) and corresponding authors (B). The best fit random method is shown in orange (open triangles the actual data points, solid line the best fit linear regression analysis), and the decade method in gray circles for that respective year. For the random method the best fit linear regression for female first authors is represented by the equation: %female 1st authors = −1844.6 + 0.94(year), r2 = 0.45, p = 0.00005. The best fit linear regression for female corresponding authors is represented by the equation: %female corresponding authors = −1420.4 + 0.72(year), r2 = 0.28, p = 0.0025.