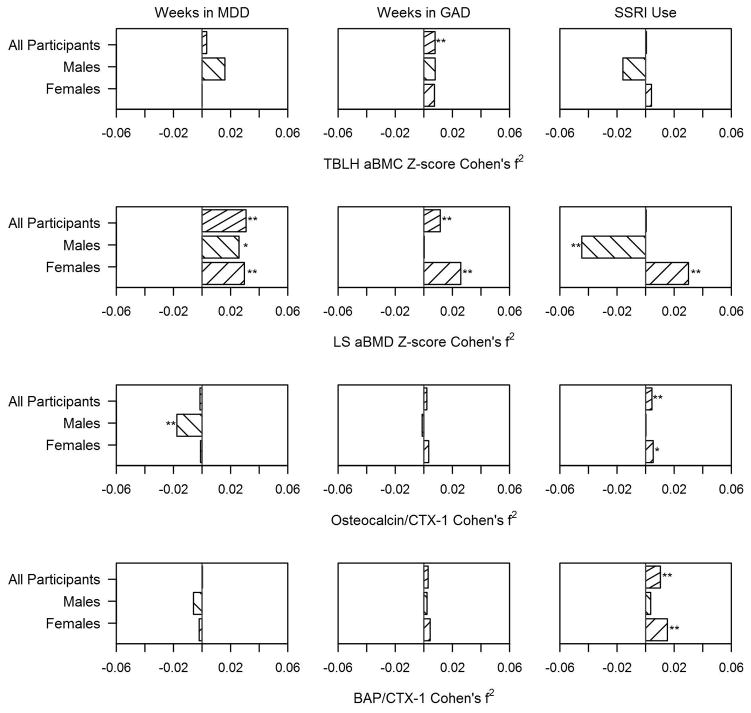
Figure 1.
Cohen’s f2 effect size comparing the “within-subject” association, from the linear mixed effects regression model, of weeks meeting criteria for major depressive disorder (MDD) and for generalized anxiety disorder (GAD), and use of selective serotonin reuptake inhibitors (SSRI) with the skeletal outcomes in the entire samples and in males and female participants. Effect sizes for inverse associations have been assigned a negative value. Top panel: TBLH aBMC (Total body less head areal bone mineral content). Second panel: LS aBMD (Lumbar spine areal bone mineral density). Third panel: Ratio of osteocalcin to CTX-1 (C-terminal telopeptide). Bottom panel: Ratio of bone-specific alkaline phosphatase (BAP) to CTX-1. One asterisk denotes marginally significant results (p < 0.10) and two denote significant results (p < 0.05).

