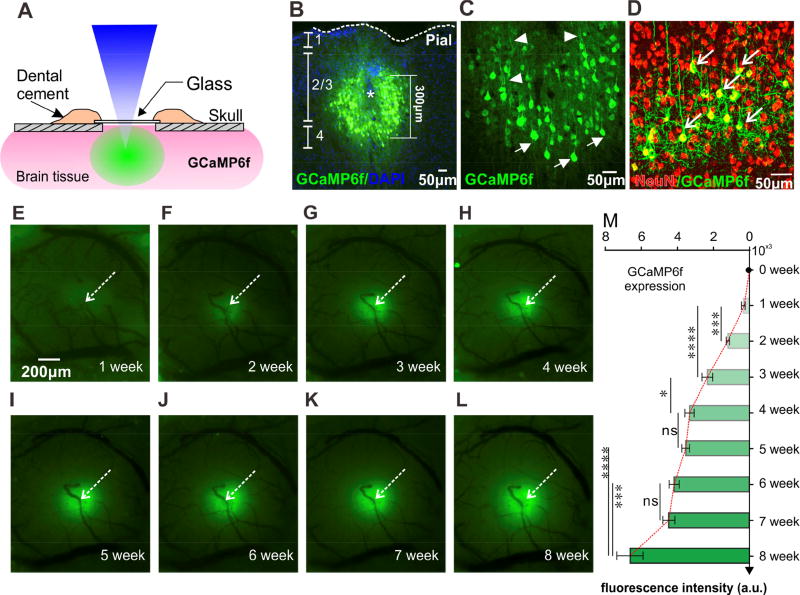
Figure 2. GCaMP6f Imaging in the sensorimotor cortex, indicating its neuronal uptake.
A): Schematic illustration of the optical imaging window.
B–D): Immunohistochemical images of GCaMP6f within cortex. B: cross-section imaging of a brain sample, indicating GCaMP expression around the injection site within the cortex; C: Magnification view of G-CaMP expressing, indicating cellular uptake; D: GCaMP6f staining overlapping with neuronal marker NeuN, indicating GCaMP uptake specifically in neurons.
E–I): Fluorescence images obtained weekly following GCaMP virus injection, i.e., from first week to eighth week, indicating the spatial expression of GCaMP6f within the cortex.
M): Development of GCaMP6f fluorescent (F) as a function of time, indicating the gradual increase in F from the second week to the sixth week and up to the eighth week post-injection (*: p< 0.05; ***: p<0.001; ****: p<0.0001; ns: no significant difference. N=6).
Data are mean ± SEM. See also Fig. S2 for more details

