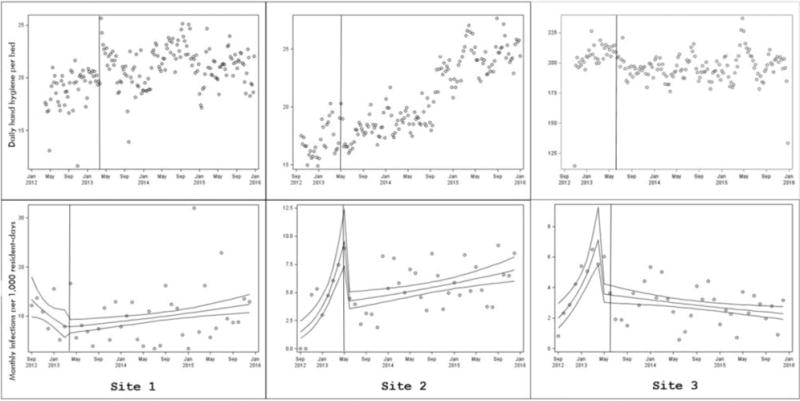
Figure 2.

Top: Markers depict total daily HHHH events per bed, excluding school units. Vertical line is date of onset of intervention. Generalized linear mixed models with negative binomial distribution were used to assess post-intervention changes in HHHH events accounting for clustering by unit. Bottom: Markers depict total monthly infections per 1000 resident-days. Slopes represent estimated means (95% confidence intervals) modeled using logistic segmented regression. Note. Graph axes differ by site.
