Figure 2.

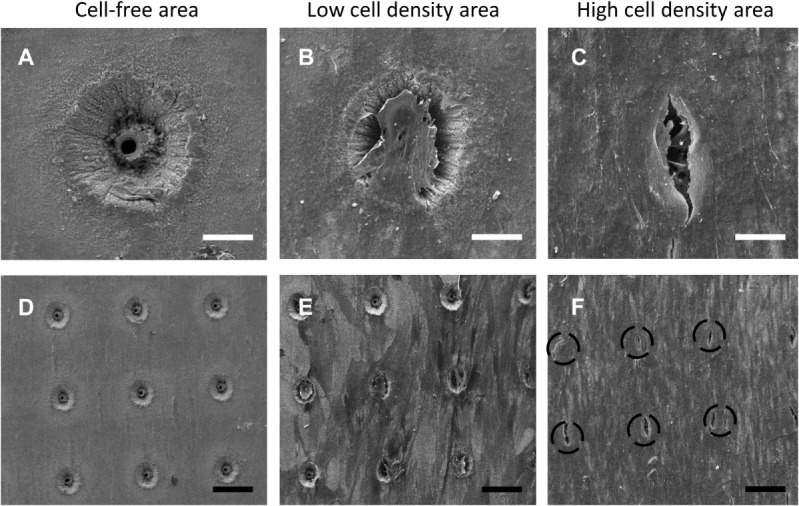
Scanning electron microscopy (SEM) images of skeletal stem cell (SSC)-seeded ethylene oxide sterilization (EOS) titanium scaffolds at day 14 demonstrating the variation in cell density in different areas of a template, in addition to the effect of cell density on cell behavior on the template surface and pore areas: (A) 90-µm pore, no cells (scale bar represents 35 µm). (B,C) 90-µm pore appearance as cell density increases (scale bar represents 40 µm), demonstrating cells bridging the pores. (D) 90-µm pore surface without cells (scale bar represents 130 µm). (E,F) 90-µm pore surface appearance as cell density increases (scale bar represents 150 µm). Black dashed circles mark the position of 90-µm pores.
