FIGURE 4.
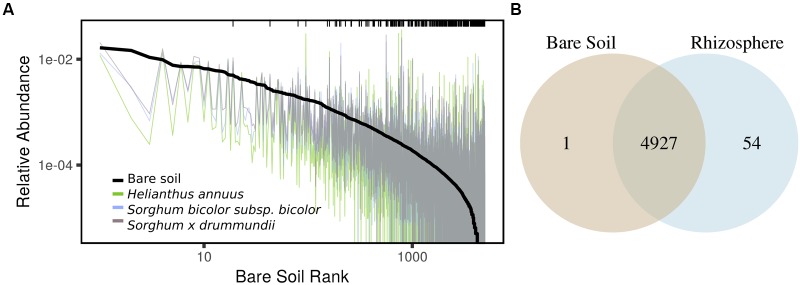
(A) Variation in OTU mean relative abundance from bare soil to rhizosphere of three representative species sampled on a single date. Black line indicates rank abundance in bare soil and colored traces indicate shifts in OTU relative abundance in rhizosphere samples. Black ticks indicate positive rhizosphere responders identified on any sampling date (DESeq2: log2-fold change > 0.5; adjusted p < 0.05), highlighting the enrichment in the rhizosphere of taxa at low abundance in bulk soil. (B) OTUs detected in bare soil and rhizosphere samples in full dataset.

