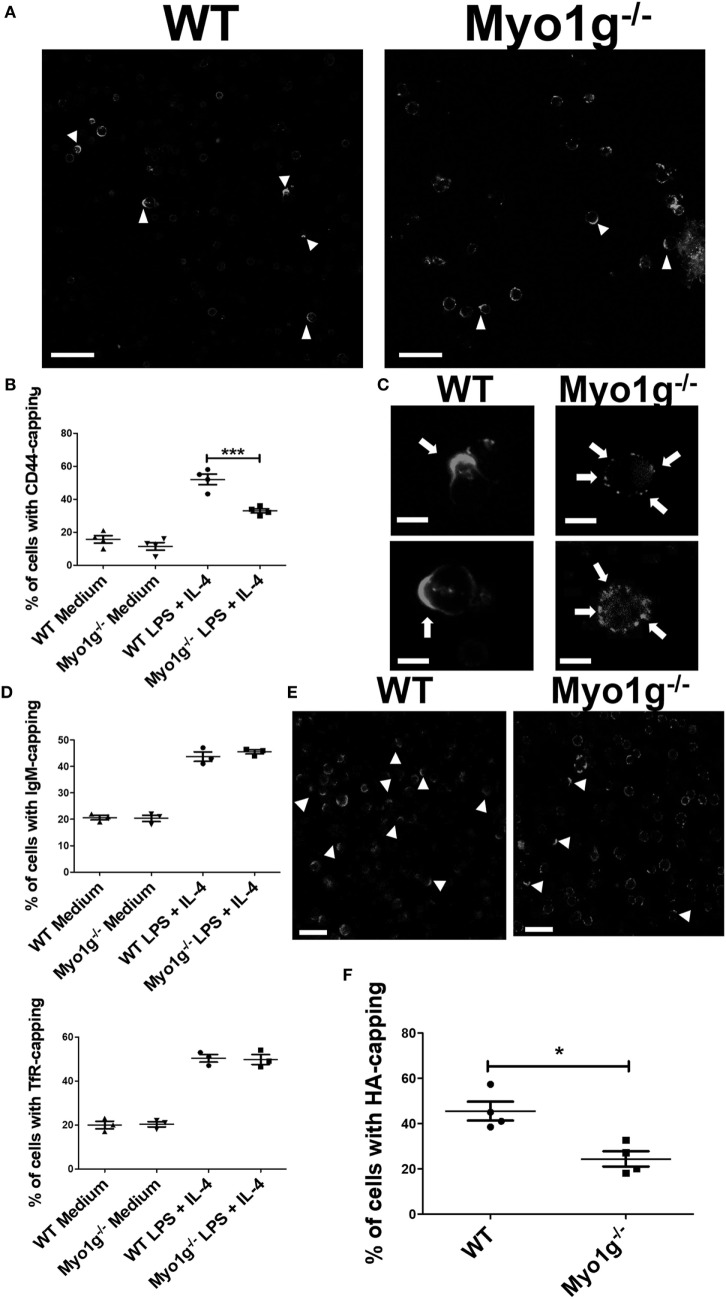
Figure 1.
The absence of Myo1g affects the polarization of CD44 in B cells. (A) Confocal images of LPS plus IL4-activated WT or Myo1g−/− B cells. Arrows illustrate CD44 localization in B lymphocytes (scale bar 60 µm). (B) Percentage of cells with CD44-capping (50 cells were counted per experiment in four independent experiments, 200 cells per data set). (C) Enlarged confocal images of LPS plus IL4-activated WT or Myo1g−/− B cells. Arrows illustrate CD44 localization in B lymphocytes (scale bar 5 µm). Graphs of transferrin receptor (TfR), or IgM-capping (50 cells were counted per experiment in three independent experiments, 150 cells per data set). (D) Images of randomly selected files were taken and the percentage of B lymphocytes with capping was calculated (50 cells were counted per experiment in 4 independent experiments, 200 cells per data set). One-way ANOVA tests were used in (B,D) graphs, values are mean ± SD (***P < 0.001). (E) Confocal images of LPS plus IL4-activated from WT or Myo1g−/− B cells. Arrows illustrate hyaluronic acid (HA) localization in B lymphocytes (scale bar 60 µm). (F) Percentage of cells with HA-capping; images of randomly selected files were taken, and the percentage of B lymphocytes with capping was calculated. A total of 200 cells was analyzed. Student’s t-test test was used in this graph, values are mean ± SD (50 cells were counted per experiment, in four independent experiments, 200 cells per data set) (*P < 0.05).

