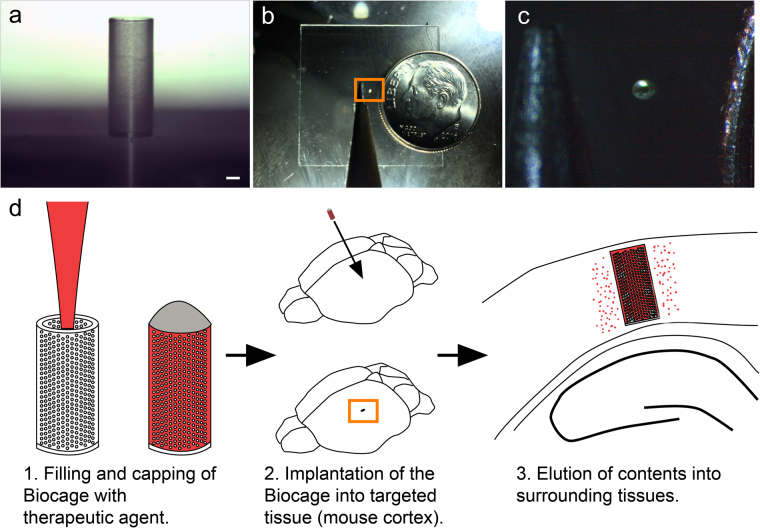
Figure 1.
The Biocage and its relative size. (a) Light microscopy image of the Biocage device showing its relative proportions and porous exterior. Scale bar = 100 µm. (b and c) Relative size of the Biocage. Biocage from the top-down viewpoint is displayed in relation to a pencil tip (to the left) and dime (to the right) to reflect its miniature size. (c) is a higher magnification of the boxed area in (b). (d) Schematic of the workflow for implantation of the Biocage. Biocages are first filled with the desired therapeutic molecules and capped. The device is then inserted into the targeted tissue of interest (in our example, a mouse cortex). The contents are allowed to elute into the local surrounding areas of the tissue.

