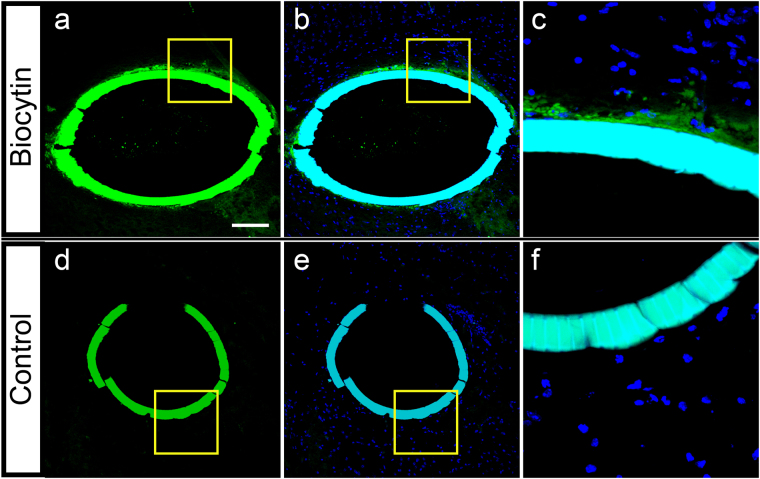
Figure 10.
Release of biocytin from the Biocage after 24 hour in vivo implantation. (a–c) Biocages were filled with biocytin in 0.35% agarose and capped. Biocytin labeling is visible in both the Biocage and areas immediately surrounding the Biocage (a, green puncta). Cells are only observed surrounding the enclosed Biocage (b, counterstain with DAPI for nuclei). (c) Is a higher magnification of the area denoted by the yellow box in (a and b) showing the biocytin released from the Biocage. (d–f) Control Biocage only filled with 0.35% agarose and capped. No puncta is observed within or outside of the Biocage (d). Cells are also not observed within the Biocage (e). (f) is a higher magnification of the area denoted in (d and e). Scale bar = 100 µm.

