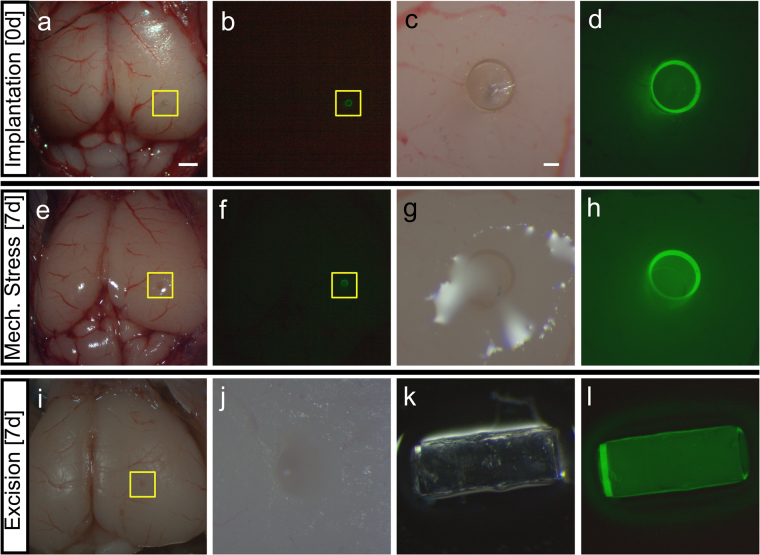
Figure 7.
Implantation, mechanical stress, and excision of Biocage in the ex vivo mouse brain. (a–d) Implantation of the Biocage. Light (a and c) and fluorescent (b and d) images showing the device in comparison to the rest of the brain. Biocages were filled with 0.35% agarose prior to implantation into ex vivo mouse cortex. c and d are higher magnification views of the areas denoted by yellow boxes in a and b, respectively. n = 3/3 brains successfully implanted. (e–h) Light (e and g) and fluorescent (f and h) images of implanted Biocages after 7 days of mechanical stress of the same brain shown in (a–d). Following implantation, brains were fixed with 4% paraformaldehyde overnight to prevent tissue decay, and shook on a circular rocker for a period of 7 days. Biocages were still present within the tissue without movement seen from site of implantation (compare a and b to e and f). (g and h) are higher magnification views of the areas denoted by yellow boxes in e and f, respectively. n = 3/3 brains. (i and j) Excision of the Biocage from the tissue. Biocages are successfully excised from the tissue (i) without displaying additional damage to the brain (j). j is a higher magnification of the area denoted by the yellow box in i. (k and l) Light (k) and fluorescent (l) images of Biocages after mechanical stress and removal. Biocages remained wholly intact after stress and removal. n = 3/3 Biocages successfully excised. Scale bar for a and b, e and f, i = 1 mm. Scale bar for c and d, g and h, k and l = 100 µm.

