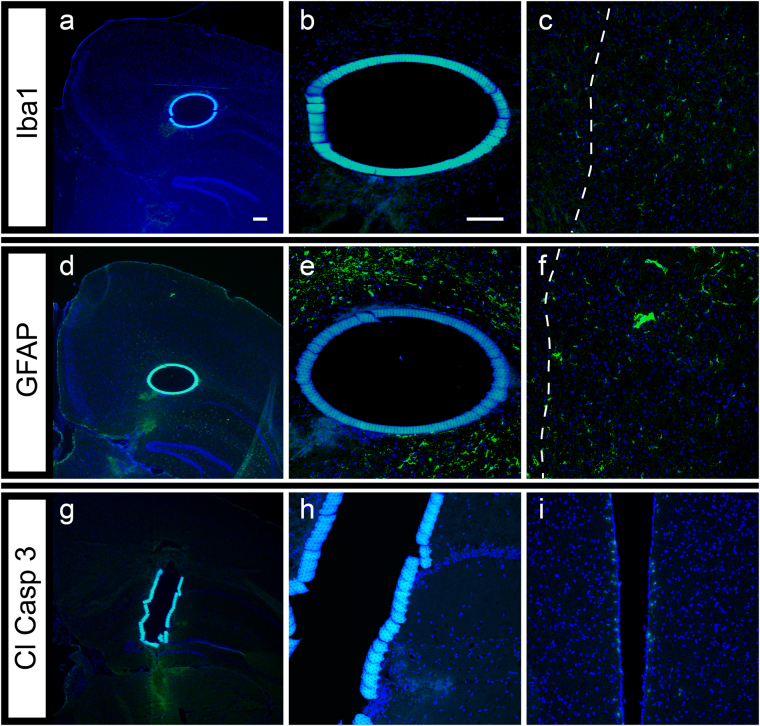
Figure 9.
Cellular impact of filled and capped Biocages after 24 hours in vivo implantation. (a–c) Microglia response observed around the Biocage after 24 hours. Brains with the implanted device were cryosectioned from the top-down view of the device and placed on slides for processing. Staining using the microglia marker Iba1 (a) shows few cells around the Biocage (b), while several cells are apparent near the needle track (in which the Biocage was implanted; dotted line) (c). (d–f) Astrocytic response around the Biocage after 24 hours. Staining of cryosections from the top-down view of the device with the astrocyte marker GFAP (d) shows a limited astrocyte response immediately around the Biocage (e), though similar to the Iba1 labeling, astrocytes were apparent around the needle track region (dotted line) (f). (g–i) Cell death around the Biocage after 24 hours. Cryosections of the side view of the device shows few cells positively labeled for cleaved Caspase 3 (Cl Casp 3) (g) observed around the Biocage (h). Staining was observed in other areas of the brain where normal programmed cell death is occurring, including the fourth ventricle (i). Scale bars = 100 µm.

