Figure 3.
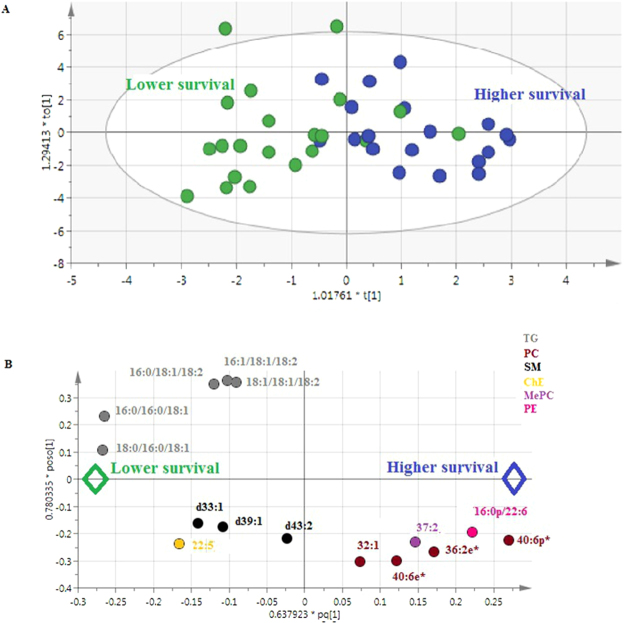
Multivariate analysis (OPLS-DA) of CSF lipids from patients with ALS (n = 40) revealed 16 lipids involved in survival. (A) Score scatter plot. Blue dots: ALS patients with survival > median; green dots: ALS patients with survival < median. X-axis and Y-axis represent score vectors summarizing all the variables entering the analysis: t1 and to1 (B) Loading scatter plot. Variables near each other are positively correlated; variables opposite to each other are negatively correlated. Variables closer to dots corresponding to “higher survival” or “lower survival” (i.e. with the largest absolute loading values) are higher in the corresponding populations. Lipids from the same family are represented with the same color.

