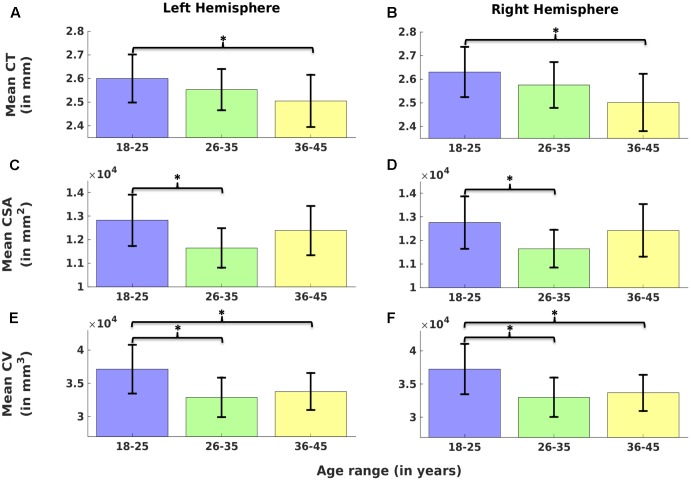
FIGURE 2.
Comparison of cortical measures (Cortical thickness: CT, cortical surface area: CSA, and cortical volume: CV) across age groups. Mean CT (A,B), mean CSA (C,D) and mean CV (E,F) over left (A,C,E) and right hemisphere (B,D,F) are plotted across three age groups (G1: 18–25, G2: 26–35, and G3: 36–45). Error bars represent the standard deviation. Significant differences are denoted by ∗(one-way ANOVA, p < 0.05, corrected for multiple comparisons).

