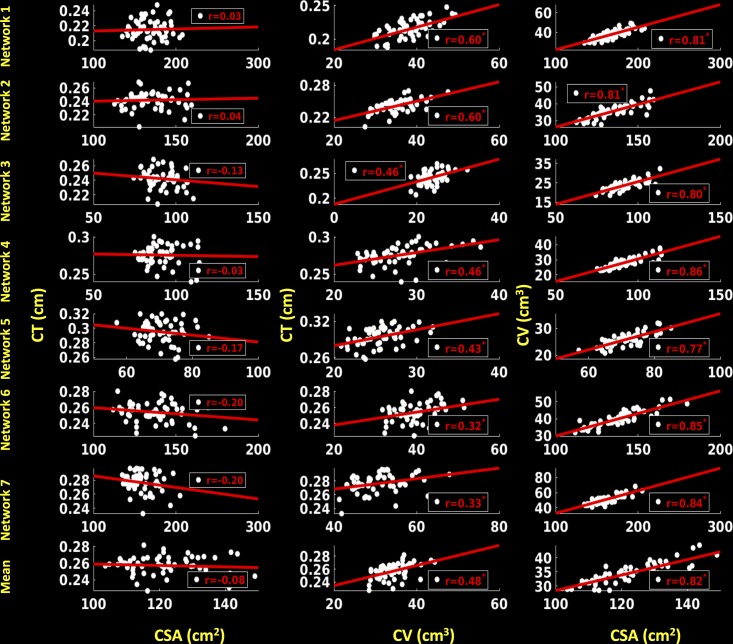
FIGURE 9.
Correlations between cortical surface area (CSA) and cortical thickness (CT), cortical volume (CV) and CT and between CSA and CV for right hemisphere. Linear plots showing non-significant association between CSA (cm2) and CT (cm), significant or trend toward significant positive association between CV (cm3) and CT (cm) (∗p < 0.05, corrected for multiple comparisons), and significant positive association between CSA (cm2) and CV (cm3) (∗p < 0.05, corrected for multiple comparisons) for seven functional networks and mean over seven functional networks on right hemisphere.

