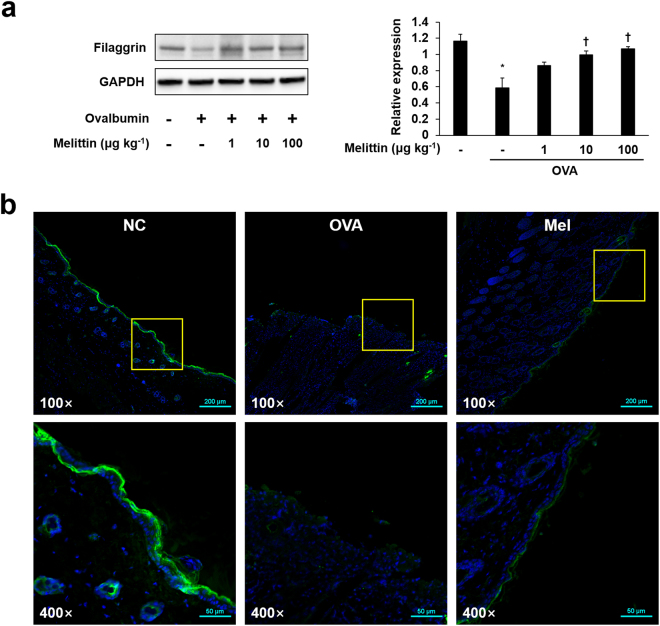
Figure 3.
Melittin improved OVA-induced filaggrin deficiency. (a) Western blot analysis shows filaggrin and GAPDH protein expressions in the mouse dorsal skins of each group. GAPDH was used to confirm equal sample loading. The bar graph shows the quantitative signal intensity of filaggrin after normalization with GAPDH. The images are representative of three independent experiments. The results are expressed as means ± SEM. *p < 0.05 compared with the NC group. † p < 0.05 compared with the OVA group. +: treated; −: untreated. The samples were derived from the same experiment and that blots were processed in parallel. The blots were cropped and full-length the blots can be found in Supplementary Fig. S1a (b) Representative immunofluorescence images show the expressions of filaggrin (labeled with Alexa Fluor 488, green). The nuclei were labeled with Hoechst 33342 (blue). NC: normal control; OVA: ovalbumin; Mel; 100 μg kg−1 melittin; 100×: 100-fold magnification; 400×: 400-fold magnification. The scale bars of the three upper images are 200 μm, whereas those of the three bottom images are 50 μm.

