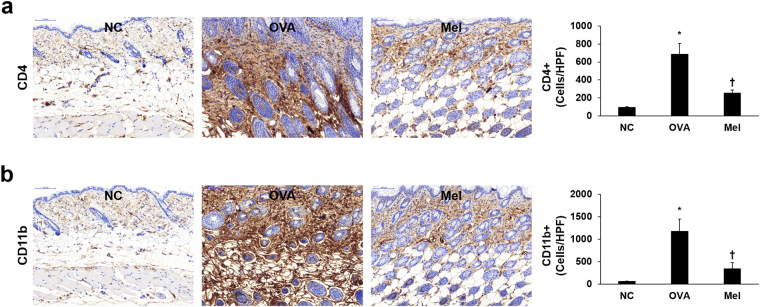
Figure 4.
Distribution of CD4+ and CD11b+ cells in mouse dorsal skin sections. Representative immunohistochemical analysis with CD4 and CD11b antibodies shows the expressions of CD4 (a) and CD11b (b), indicated in brown color. The integrated optical densities were measured from at least five random fields per section at 200-fold magnification, respectively. Results are expressed as means ± SEM. *p < 0.05 compared with the NC group. † p < 0.05 compared with the OVA group. NC: normal control; OVA: ovalbumin; Mel: 100 μg kg−1 melittin; HPF: high-power field.

