Figure 5.
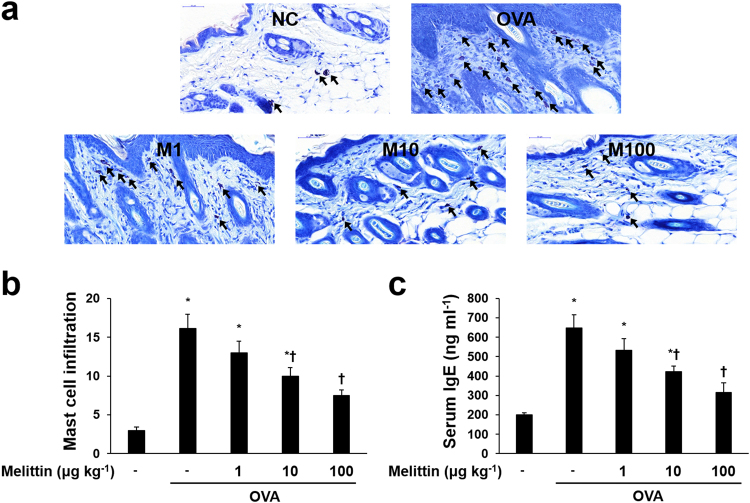
Effects of melittin on the OVA-induced increased mast cells and serum-IgE. (a) Representative images of histologic analysis with Giemsa staining showed that OVA increased the infiltrations of mast cells (arrows), whereas melittin decreased them. Scale bar = 50 μm. (b) The number of infiltrated mast cells was counted from at least five random fields per section at 400-fold magnification. The results are expressed as means ± SEM. (c) ELISA results demonstrate that melittin suppressed OVA-induced increased serum-IgE concentrations. The results are expressed as means ± SEM of three independent experiments. *p < 0.05 compared with the NC group. † p < 0.05 compared with the OVA group. NC: normal control; OVA: ovalbumin; M1, M10, and M100: 1, 10, and 100 μg kg−1 melittin; −: untreated.

