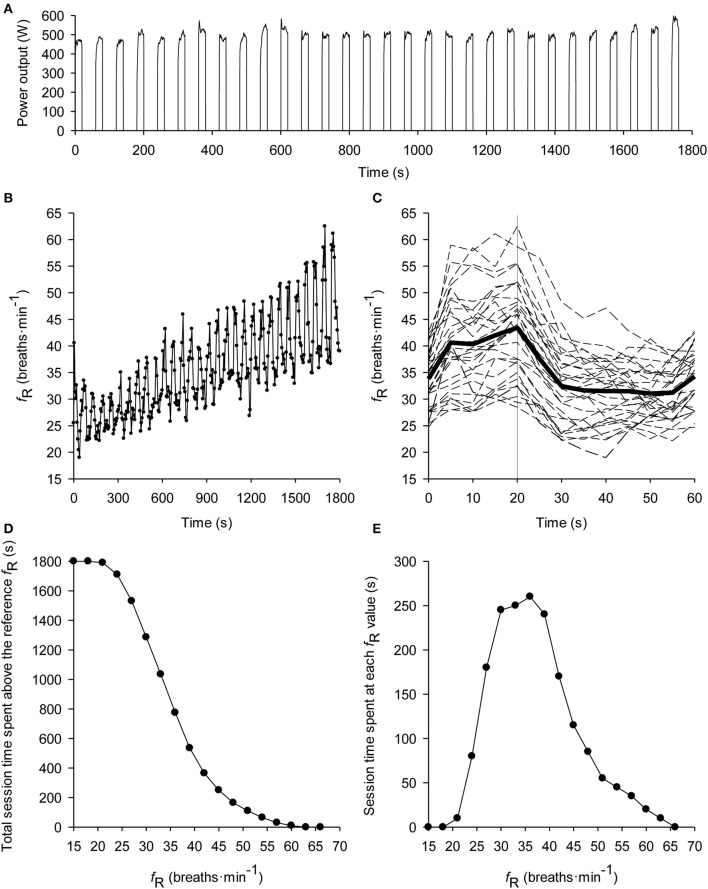
Figure 1.
Typical subject performing a 20-s work 40-s rest self-paced intermittent cycling time trial lasting 30 min (i.e., 30 repetitions). Data are from Nicolò et al. (2014a). The time course of power output is depicted in (A). Of note, fR responds very fast to the alternation of the work and recovery phases, and increases progressively over time (B). The rapid change in fR according to variations in workload can be better observed by showing the time course of fR within the 60-s work-recovery cycle (C). The solid thick line represents the average of the entire trial, the dashed lines represent each repetition and the solid vertical line separates the 20-s work from the 40-s recovery. For details on this analysis see Nicolò et al. (2014b). This is also a convenient representation to show fR data real time during HIIT. In order to synthesize the effort of the training session, the fR distribution (D) and concentration (E) profiles have also been constructed. The distribution profile describes the time spent above each fR-value, while the concentration profile describes the time spent at each fR-value. Both analyses can also be used to describe several training sessions. See Kosmidis and Passfield (2015) for more details on the two analyses.

