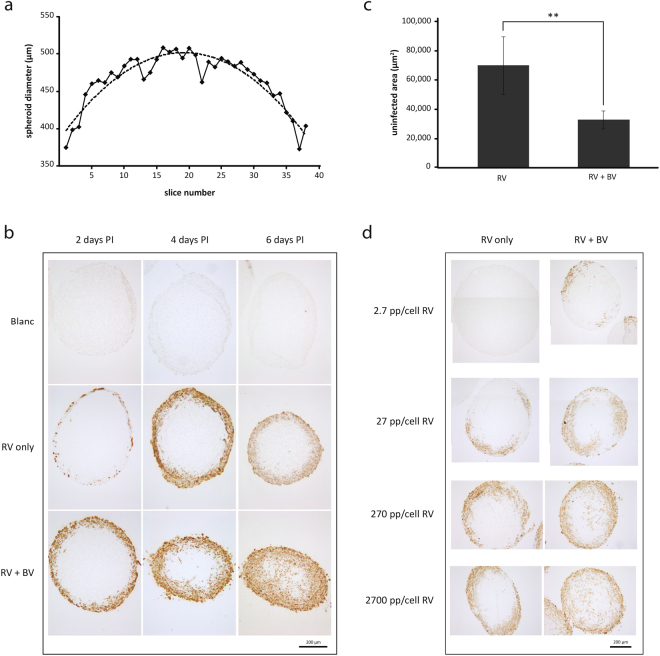
Figure 5.
Improved penetration and spread of RV in U-118 MG spheroids upon infection with BVJAM-RV. (a) Example of a graph assigning the midpoint of a spheroid. After the spheroids (25,000 cells at start) were fixed and sectioned, the diameter of each of the spheroid sections was measured. These values were combined in a graph as represented here and the trend line through the data points was used to determine the spheroid section with the largest diameter. (b) Representative images of RV penetration analysis in U-118 MG spheroids, either as single agent (10,000 vp/cell) or in combination with BVJAM in a RV:BVJAM ratio of 1:2.5. Two, four and six days post-infection spheroids were fixed, sliced and stained for the presence of RV capsid protein σ3 by immunocytochemistry. (c) Uninfected area of spheroids infected as in (b) with RV only or the BVJAM-RV complex at six days post-infection. For each spheroid the uninfected area of three to five middle sections was measured and averaged. The error bars represent the standard deviation (n = 4 spheroids), p value: ** = 9.2E-3. (d) Representative images of RV titration experiment on spheroids infected with RV only or in the presence of a surplus of BVJAM at six days post-infection through immunocytochemistry staining for RV capsid protein σ3.

