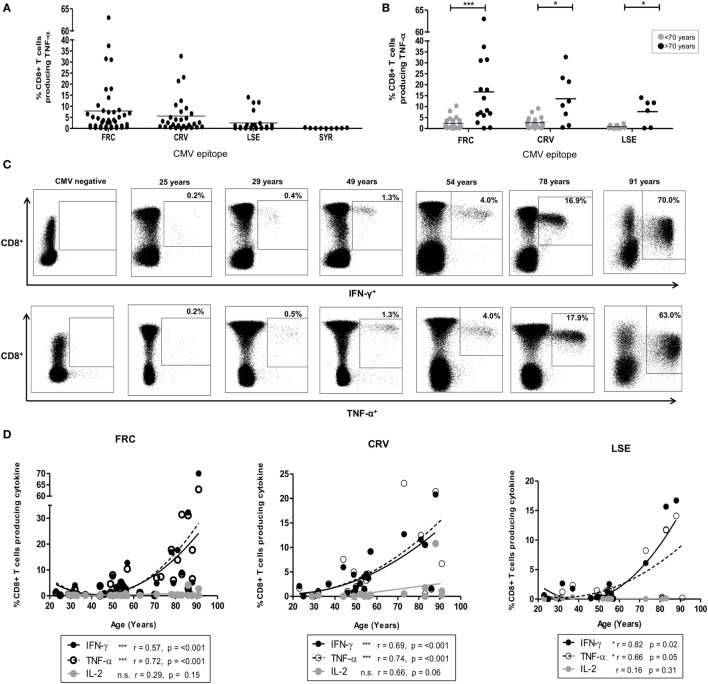
Figure 1.
CD8+ T-cell response after stimulation by cytomegalovirus (CMV) peptides restricted by HLA-Cw*0702. (A) The magnitude of CD8+ T-cell TNF-α production in response to peptide stimulation in HLA-Cw*0702+ CMV-seropositive donors. Peptide-specific CD8+ T-cells were identified after peptide stimulation and intracellular cytokine staining. Each symbol represents the percentage of an individual donor’s total CD8+ T-cell pool producing TNF-α in response to the peptide. The peptide name and temporal pattern of expression during the viral lifecycle are shown on the x-axis. Horizontal lines represent the mean. (B) The magnitude of CD8+ T-cell TNF-α production in response to peptide stimulation in HLA-Cw*0702+ CMV-seropositive donors aged <70 or >70 years of age. Peptide-specific CD8+ T-cells were identified as in panel (A). Each symbol represents the percentage of an individual donor’s total CD8+ T-cell pool producing TNF-α in response to the peptide. Gray circles represent donors <70 years of age, and black circles represent donors >70 years of age. Horizontal lines represent the mean. Statistical significance was determined by Mann–Whitney within GraphPad Prism 6 (*p < 0.05 and ***p < 0.001). (C) Representative plots of CD8+ T-cell cytokine production in six donors following stimulation with FRC peptide. FRC-specific CD8+ T-cells were identified as in panel (A) to assess IFN-γ (top row) and TNF-α (bottom row) production. CD8 expression is shown on the y-axis and cytokine expression on the x-axis. The age of the donor is provided above the representative plots. The gating strategy is provided in Figure S2 in Supplementary Material. (D) Magnitude of cytokine production following stimulation with peptides FRC, CRV, and LSE shown in donors according to age. Peptide-specific CD8+ T-cells were identified as in panel (A). The age of the donors in years is shown on the x-axis, and the percentage of the total CD8+ T-cell cytokine response is provided on the y-axis. Significance was calculated by Spearman’s rank correlation.

