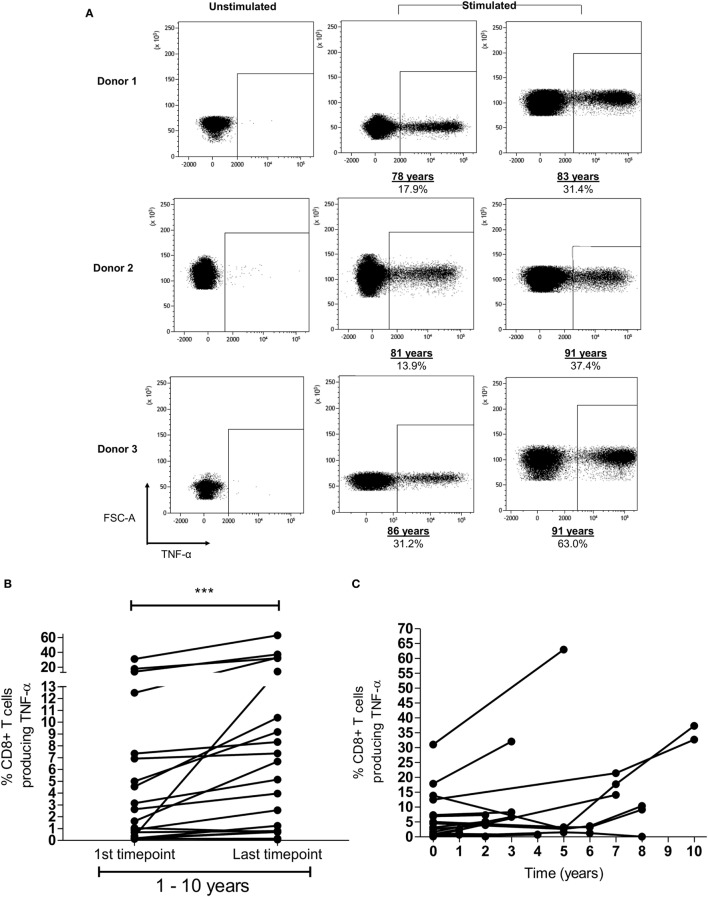
Figure 3.
Memory inflation of HLA-Cw*0702-restricted T-cell responses is seen within individual donors. (A) Example of memory inflation within donors. FRC-specific CD8+ T-cell responses were followed within nine donors using blood samples taken between 1 and 10 years apart. This figure shows the TNF-α response in three donors at the initial and final time points. Percentages represent the TNF-α response to peptide as a proportion of the total CD8+ T-cell repertoire. The same number of lymphocytes is demonstrated in the two representative plots at each time point per donor. [Additional time points are provided in panel (C).] (B) Summary of longitudinal analyses of peptide-specific CD8+ T-cell responses. The initial and last time points (after 1–10 years) for each HLA-Cw*0702-restricted CD8+ T-cell response are shown for all nine donors. Statistical significance was determined by a paired Wilcoxon test. (C) Representation of all prospective peptide-specific T-cell responses at individual time points within each donor.

