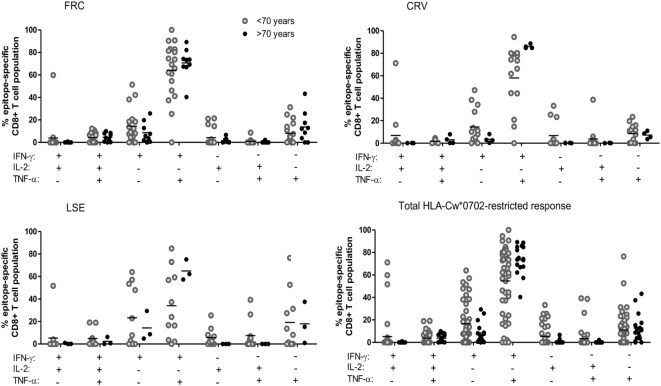
Figure 4.
The pattern of co-expression of IFN-γ, TNF-α, and Il-2 cytokines within HLA-Cw*0702-restricted cytomegalovirus-specific CD8+ T-cells. Co-expression of the three cytokines was determined within CD8+ T-cells following stimulation with peptide. The co-expression of IFN-γ, IL-2, and TNF-α by the total FRC (top left), CRV (top right) and LSE-specific CD8+ T-cell populations (bottom left) and total HLA-Cw*0702 CD8+ T-cell responses (bottom right) observed within all donors are represented. Donors were assigned into two groups based on age <70 or >70 years. The different combinations of IFN-γ, IL-2, and TNF-α co-expression are indicated on the x-axis. Combinations were calculated using the Boolean gating strategy in Kaluza 1.3 software, and percentages were generated using the funky cells software (36). The Boolean gating strategy is provided in Figure S8 in Supplementary Material. Statistical significance was tested by Kruskal–Wallis test with Dunn’s corrections applied in GraphPad Prism 6.

