Figure 5.

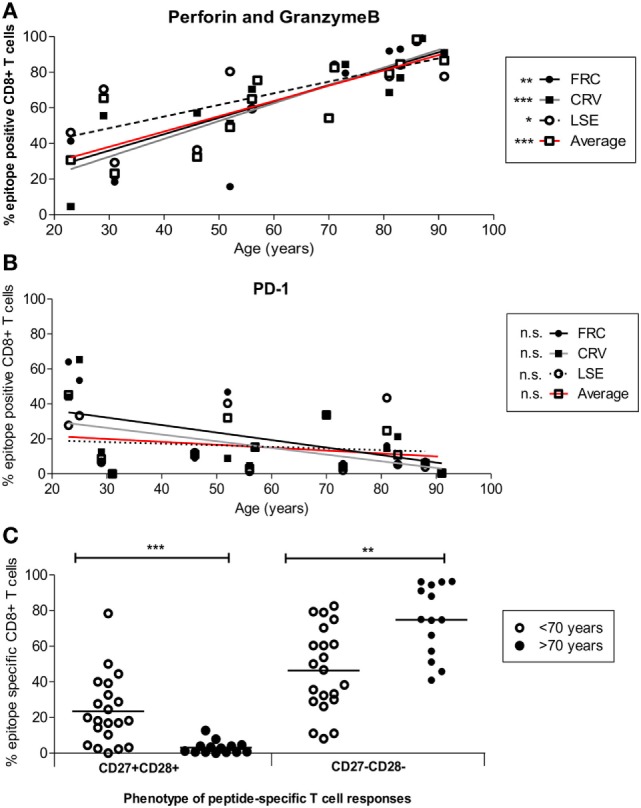
Cytotoxic and differentiation phenotype of HLA-Cw*0702-restricted cytomegalovirus (CMV)-specific CD8+ T-cells in relation to age. (A) HLA-Cw*0702-restricted CMV-specific CD8+ T-cells were identified after peptide stimulation followed by intracellular cytokine staining for TNF-α. Intracellular dual expression of perforin and granzymeB was then determined by flow cytometry. R values: FRC = 0.79, CRV = 0.90, LSE = 0.72, and Average = 0.87. (B) CMV-specific cells were identified as in panel (A) and examined for surface expression of PD-1. R values: FRC = -0.47, CRV = −0.43, LSE = −0.2, and Average = −0.25. Values are shown for each individual peptide response (FRC—black circle and black line; CRV—black squares and gray line; LSE—white circles and broken line) and also for the aggregate values of all HLA-Cw*0702-restricted cells (solid red line). Lines represent linear regression, and statistical significance was obtained by Spearman’s rank correlation in GraphPad Prism 6 (*p < 0.05, **p < 0.01, and ***p < 0.001). (C) HLA-Cw*0702-restricted CD8+ T-cells were identified as in panel (A). The differentiation status of the epitope-specific CD8+ T-cell responses was then analyzed using CD27 vs CD28 expression. Statistical significance was determined by Mann–Whitney test in GraphPad Prism 6 (**p < 0.01 and ***p< 0.001).
