Figure 6.
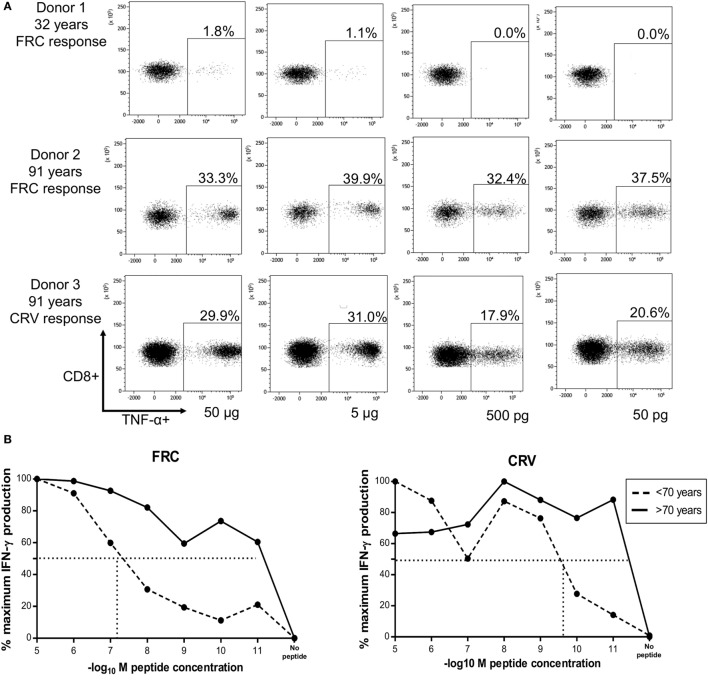
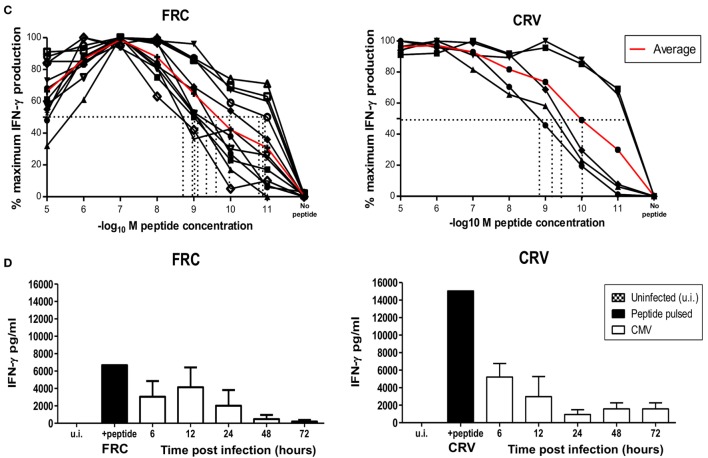
HLA-Cw*0702-restricted CD8+ T-cells have high avidity and recognize cells in the immediate-early time point of viral infection. (A) TNF-α production by PBMCs in response to HLA-Cw*0702-restricted peptide gradient. 50,000 PBMCs were incubated with peptide concentration of 50 pg (10−11) to 50 µg (10−5) in the presence of brefeldin A followed by intracellular cytokine staining for TNF-α. The EC50 was defined as the peptide concentration that induced the 50% maximal TNF-α production by HLA-Cw*0702-restricted CD8+ T-cells as a percentage of the total CD8+ T-cell population. Percentages represent the percentage of the total CD8+ T-cell pool responding to that concentration of HLA-Cw*0702-restricted peptide. The two highest (50 and 5 µg) and two lowest (500 and 50 pg) peptide concentrations are shown as representative examples. (B) Functional avidity of HLA-Cw*0702-restricted cytomegalovirus (CMV)-specific PBMC. 50,000 PBMCs from three young (32, 46, and 56 years) and three elderly donors (83, 91, and 91 years) were incubated with peptide concentrations of 50 pg (10−11) to 50 µg (10−5), and the EC50 was defined as in panel (A). This was determined within GraphPad Prism 6 by applying a sigmoidal dose response curve. Percentages represent the percentage of the total CD8+ T-cell pool responding to that concentration of HLA-Cw*0702 peptide. Younger donors (<70 years) are represented by dashed lines, and older donors (>70 years) represented by solid black lines. Lines represent the average percentage of PBMCs responding to that peptide gradient (FRC—left graph and CRV—right graph) within n = 3 donors per age group. (C) Functional avidity of HLA-Cw*0702-restricted CMV-specific CD8+ T-cell clones. CD8+ T-cell clones were isolated by limiting dilution analysis from HLA-Cw*0702+ CMV-seropositive donors. 1,000 CD8+ T-cell clones were cocultured for 16 h with 5 × 10⁴ peptide-pulsed LCL loaded with a peptide concentration gradient of 50 pg (10−11) to 50 µg (10−5). CD8+ T-cell activation was analyzed by IFN-γ ELISA. n = 12 clones for FRC and n = 5 for CRV. The EC50 was determined as in panel (B). The red line represents the average EC50 avidity of the CD8+ T-cell clones. (D) Time course of recognition of HLA-Cw*0702-restricted CMV peptides during viral infection. The presentation of HLA-Cw*0702-restricted peptides during CMV infection was determined by recognition by virus-specific T-cell clones following infection of MRC5 fibroblasts (HLA-A2+HLA-Cw*0702+) in vitro. 10,000 CD8+ T-cells were cocultured with the infected fibroblasts, and IFN-γ ELISA was used to measure peptide recognition at the indicated time points. Left graph = FRC-specific T-cell clones and right graph = CRV-specific T-cell clones. n = 3–6 per time point and n = 3 clones tested per specificity. ui, uninfected cells; peptide, target cells pulsed with cognate peptide. Target cells were infected with AD169 virus at an MOI of 5. The peptide-pulsed control bar represents the average of all experiment replicates.


