Fig. 3.
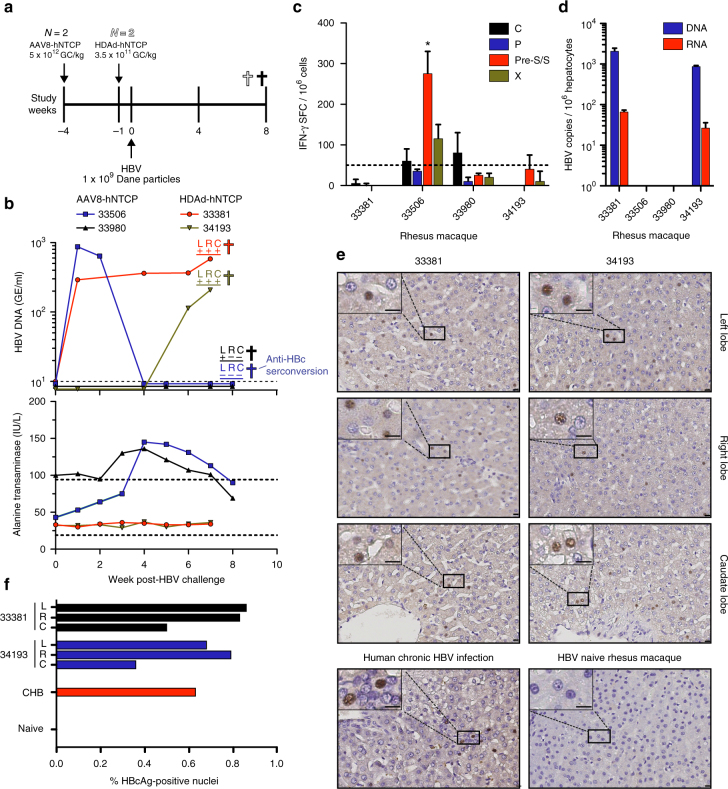
In vivo HBV infection of rhesus macaques. a Timeline showing administration of viral vectors encoding hNTCP, HBV challenge, and necropsy of rhesus macaques. GC = genome copies. b Longitudinal monitoring of HBV infection by HBV DNA (dotted line represents assay limit of detection) and alanine transaminase concentrations (dotted lines represent normal alanine transaminase reference range in ONPRC colony) in the serum. c IFN-g ELISpot measurements of liver-resident T-cell responses against HBV C, P, S, and X. * = Response met statistical significance, defined as mean number of spot forming cells (SFCs) of triplicate sample wells exceeding background (no stim) plus two standard deviations in a homoscedastic t-test. Dotted line represents assay limit of detection. d Levels of HBV DNA and RNA as assessed by qPCR and qRT-PCR, respectively, in rhesus macaque PH isolated from the liver via collagenase media perfusion. e HBcAg immunohistochemistry from HBV-infected rhesus macaque liver lobes, HBV naive rhesus macaque liver, and chronically HBV-infected human liver. Size bars indicate distance of 10 μm. f Quantification of HBcAg immunohistochemistry in e showing average frequency of HBcAg-positive nuclei (include parenchymal and non-parenchymal cells) from indicated liver lobes. Human CHB and naive rhesus macaque samples represent a single-biological sample (N = 1). CHB = Human chronic HBV infection, L = left liver lobe, R = right liver lobe, C = caudate liver lobe

